Knowing how fuels are used and where, and how the trend may evolve in the future, is key to develop energy infrastructures tailored to the increased electrification and use of low-carbon energy carriers that the transition to climate neutrality requires.
The JRC high-resolution EU energy atlas is a new dataset embedded in the Energy and Industry Geography Lab (EIGL), a tool that finds, filters and maps energy-related data. Combined with other datasets, the new atlas boosts EIGL’s spatial analysis capabilities. It consists of a series of EU maps with the demand of the main groups of energy products from each category of economic activity, zooming in at an unprecedented level of 1x1 km.
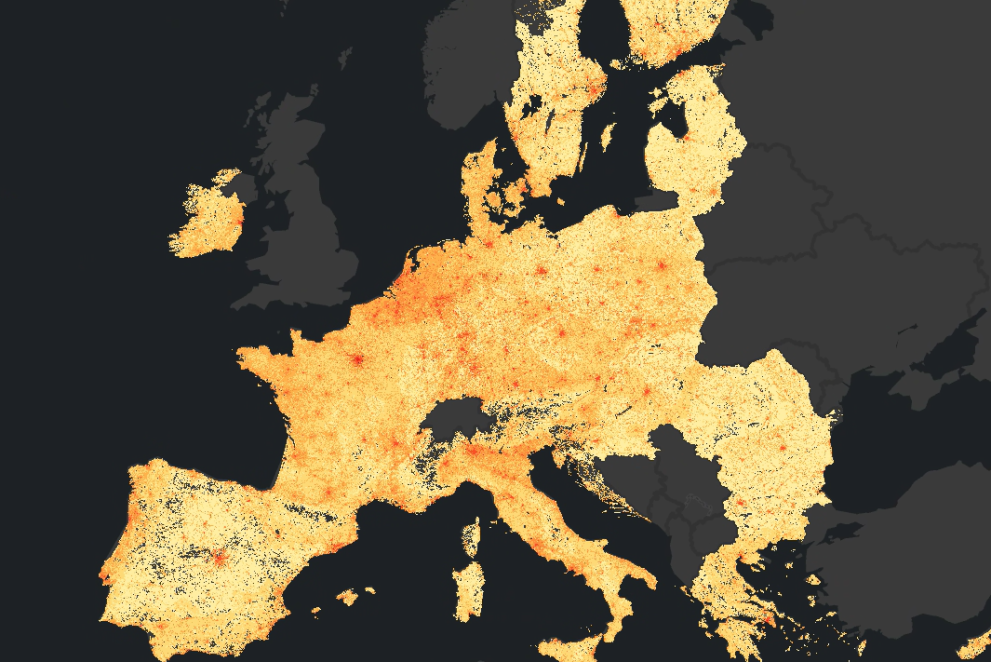
How is energy used across the EU?
The analysis of energy consumption in 2019, as explained in a digital story map, provides valuable insights into the usage patterns of different energy products in the EU. The most recent available annual energy data is from 2021 as annual energy statistics are published two years after the reporting period. However, energy consumption was still affected by the consequences of the COVID pandemic, therefore data for 2019 are used.
For instance, natural gas is primarily consumed by power plants, industry, and households, with high concentrations in densely populated areas: an example is the Barcelona metropolitan area which accounted for around 12% of Spain’s entire consumption.
Electricity consumption is also significant in urban areas, while other energy carriers, such as manufactured gases, oil shale, and waste are consumed near their sources for industrial processes. The maps also show how oil and petroleum products are consumed by refineries at specific locations, example being the areas near Rotterdam and Antwerp, along the transport network, such as the road network in north Italy, or throughout industrial and urban areas.
The same methodology used to break down national energy balances to 1x1 km cells is also applied to energy scenarios, which are energy balances projected into the future that give a long-term outlook (in this case until 2050) on economic, energy, climate and transport aspects based on existing policies.
For instance, projected changes in natural gas demand from 2019 to 2050 show a general shift towards lower consumption, indicating progress towards decarbonisation goals.
Disaggregating energy supply from energy balances and scenarios will provide a more detailed understanding of how energy is produced, traded and transformed across different regions. Based on these results, the tool will allow to carry out spatial analyses to identify patterns, bottlenecks and opportunities for optimising the energy infrastructure.
The methodology and assumptions on which the high-resolution gridded maps are based are detailed in the report High-resolution energy atlas. The full dataset can be downloaded from the JRC data catalogue EU energy atlas - demand 2019.
The making of the atlas
The project started with an analysis of energy balances, which provide a wealth of information on energy extraction, trade, transformation and consumption provided by the statistical office of the European Union (EUROSTAT). Energy balances capture data on energy products, economic categories and end-users for each country in the EU.
However, because the data is limited to a country level, restricting its analytical potential, EIGL has developed a process to estimate the energy demand at 1x1 km resolution.
The downscaling process includes utilising other datasets available from the EIGL, such as the Emissions Trading System (ETS), to identify and geographically locate energy consumption points. The remaining energy demand is allocated to smaller regions (NUTS3) using publicly available datasets from EUROSTAT on population density, economic sector and heating and cooling degree days. The heating and cooling days provide an indication of the energy consumption required for heating (in cold weather) and cooling (in hot weather).
This distribution process is then refined further by incorporating land use and land cover data from the JRC’s LUISA (Land-Use based Integrated Sustainability Assessment) Territorial Modelling Platform. By factoring in land characteristics, such as urban areas, agricultural land and natural landscapes, EIGL can estimate energy consumption in specific locations with greater accuracy.
Related content
Energy and Industry Geography Lab
Energy and Industry Geography Lab (EIGL) layers
Report: High-resolution energy atlas
Dataset: EU energy atlas - demand 2019
Details
- Publication date
- 26 February 2024
- Author
- Joint Research Centre
- JRC portfolios


