
For most of the analysed cities, tackling emitters locally – such as residential heating or road transport in cities – can effectively improve air quality, according to the Atlas. At the same time, acting at country or EU level on agriculture emissions would also be very effective.
Identifying the sources of emissions in 150 European cities, the 2023 edition of the Urban PM2.5 Atlas provides more accurate information compared to its predecessors, by relying on an updated dataset and methodology. The findings support competent authorities at city, regional, country and the EU level in designing measures to reduce air pollution, tailored to their specific circumstances.
The Atlas is published ahead of the EU Clean Air Forum, taking place on 23-24 November in Rotterdam, The Netherlands.
Particulate Matter (PM) refers to tiny particles in the air with a diameter of less than 2.5 micrometers. These particles include both primary particles like dust, smoke, soot, pollen, and soil, as well as secondary particles formed directly in the atmosphere. Due to their small size, these pollutants can penetrate the lung barrier and enter the bloodstream, resulting in severe health effects and even premature death.
While clean air legislation has led to improvements, certain regions and cities still struggle with pollution levels that exceed the World Health Organization (WHO) air quality guidelines and the EU air quality standards. Although only 2% of the monitoring stations exceeded the EU PM2.5 annual limit value (25 μg/m3) in 2021 (EEA, 2023), about 95% of them exceeded the WHO 2021 guideline (annual average of 5 μg/m3). According to current estimates, PM2.5 is responsible for around 238,000 premature deaths annually in 2020 in EU-27 (EEA, 2022).
This Atlas focuses on PM2.5 and provides 150 fiches on pollution sources affecting both the inner and greater city areas. It helps determine where and how to address these remaining air pollution problems as per the objectives of the EU’s Zero Pollution Action Plan.
Emissions by sector
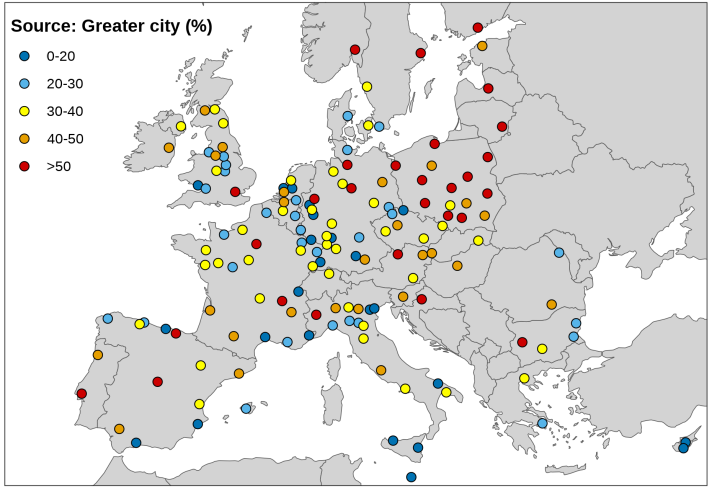
Emissions from the residential sector, including combustion in domestic heating appliances, account for an average of 30% of total air pollutants in the cities studied. Polish cities such as Warszawa, Krakow, Wroclaw, Łódź, and Bialystok have the highest contributions from the residential sector, ranging from 59% to 64%. On the other hand, Lemesos, La Valletta, Lisboa, Braunschweig and the Ruhr area record the lowest impact from this sector.
Road transport, accounting for 15% of total air pollutant across all 150 cities, sees important emissions coming from Augsburg, Stockholm and Kobenhavn with 27%, Zürich (26%) and Malmö (25%). Lemesos, Lisboa, Lefkosia, Taranto and Catania contribute less.
Although agricultural activities primarily occur outside cities, this sector is associated with a large fraction of the PM2.5 concentrations (secondary pollution) in many EU cities, especially in Western Europe (Germany, Benelux and the north of France) where the percentage of contributions in cities like Kiel, Hannover, Heidelberg, Dresden and Bremen hovers around 27%.
The largest contributions from industry, accounting for approximately 18%, are found in the Ruhr area (54%), Braunschweig (49%), Linz (36%), Lisboa (34%) and Antwerpen (33%). Emissions from this sector are lower in Palermo, Roma, La Valletta, Napoli and Verona.
The shipping sector also plays a role in PM2.5 pollution, with peak contributions in cities like Hamburg, La Valletta, Palme de Mallorca, Malaga, and Rotterdam. Emissions from shipping range from 19% to 28% in these cities.
How to tackle air pollution?
The main findings and policy recommendations arising from the study are:
- Target sectors and extent of action for reducing air pollution should be specific to each city. The impact of abatement measures varies from city to city, even within the same country: therefore, it is crucial to consider city-specific actions when designing air quality plans.
- Local actions at city level are often effective in improving PM2.5 air quality. From this point of view, measures that address residential heating (which contributes to more than 25% of PM2.5 concentrations in about half of the cities studied) can have a significant impact on reducing pollution levels.
- Sectoral measures addressing agriculture at country or EU scale can greatly benefit urban air quality. In this context, fulfilling the ammonia national emission reduction commitments under the National Emissions reduction Commitments (NEC) Directive will bring tangible benefits to several EU cities.
Background
The Atlas relies on data from SHERPA (Screening for High Emission Reduction Potential on Air), an open-access assessment tool developed by the JRC that can test a wide set of scenarios for any European city.
Leveraging an updated version of SHERPA, the Atlas provides more accurate information than ever before on how transport, agriculture, industry, residential heating and the shipping sector contribute to PM2.5 pollution.
This information empowers authorities in cities, regions, countries, and at EU level to develop tailored measures to combat air pollution effectively.
Compared to previous editions, the 2023 Atlas makes use of a new emission inventory (including condensables), an updated version of the SHERPA source-receptor relationships (distinguishing ground and elevated emission sources), an increased spatial resolution, and an updated definition of the urban areas (particularly the city cores). These improvements have an important influence on the source allocation results.
For instance, the inclusion of condensable emissions allows to identify a spike in the contribution of the residential sector in some countries, including Poland, Italy, France and Baltic countries. At country level, primary particulate matter (PPM) emissions from this sector have seen an increase of 175% in Poland and 40% in France from the 2021 edition of the Atlas.
Contributions from the agricultural sector have slightly decreased in comparison to the previous 2021 Atlas. This is because nitrogen oxides (NOx), a cluster of reactive gases, and ammonia (NH3) emission reductions have been uneven in recent years. Indeed, while NOx emissions have continued to decrease, NH3 emissions have not, leading to a change in chemical regimes.
On the contrary, the contribution from industry has decreased significantly, due to lower national emissions in this sector, especially in Eastern Europe. For example, SO2 emissions originating from the energy and industry sectors dropped by about 50% in countries like Poland and Spain.
Relevant links
Urban PM Atlas – Air Quality in European Cities, 2023 report
EU Clean Air Forum (streaming available)
SHERPA (Screening for High Emission Reduction Potential on Air) tool
Details
- Publication date
- 22 November 2023
- Author
- Joint Research Centre
- JRC portfolios


