13 October was the International Day for Disaster Risk Reduction.
The theme of this year's IDDRR is building resilience to disasters, with a focus on reducing disaster damage to critical infrastructure and disruption of basic services.
To mark this day, the JRC is presenting the recent work and developments around this theme.
Zooming in ever closer on the planet
Estimating impacts on critical infrastructure and basic services starts with an understanding of where these are.
One of the most powerful tools at our disposal is the Global Human Settlement Layer (GHSL), a JRC-developed framework to produce global spatial information on population and on the physical size of settlements on the planet.
Many further tools and products derive from this technology.
The international community is debating on an international definition of cities and degree of urbanisation.
These discussions are informed by the Global Human Settlement Layers data and models, which are essential to understand the human presence on Earth and in particular in those areas that are prone to hazards and disasters, those that require special attention by the development and international community.
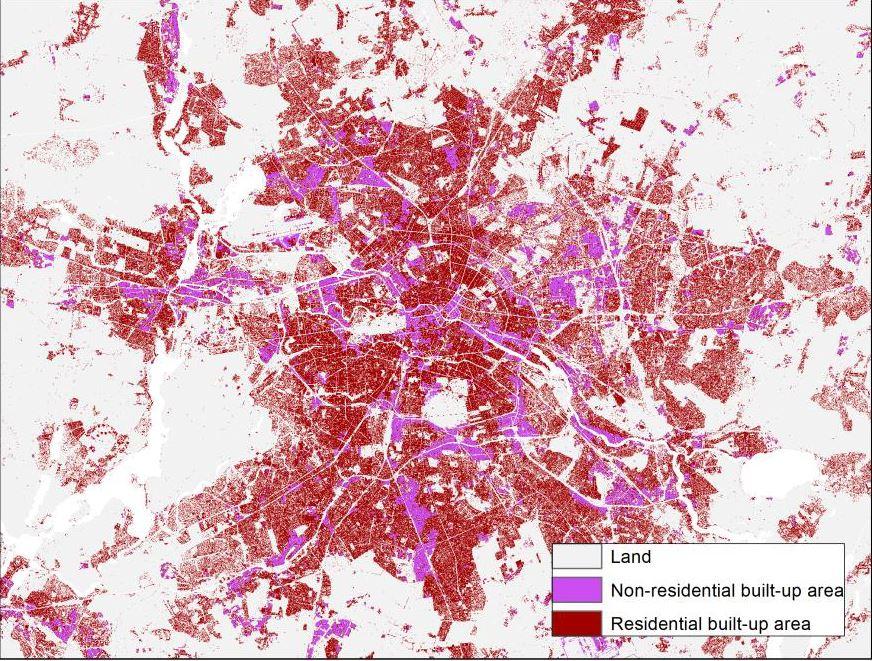
On 9 October, during the European Week of Regions and Cities, the JRC released the new European Settlement Map.
The European Settlement Map depicts all houses and settlements across Europe (39 countries including Turkey) in a consistent way and at very high spatial detail.
This is based on Earth Observation data and artificial intelligence, and allows a comparison of settlements across the continent along the urban/rural continuum provides in unprecedented detail a map of settlements in Europe.

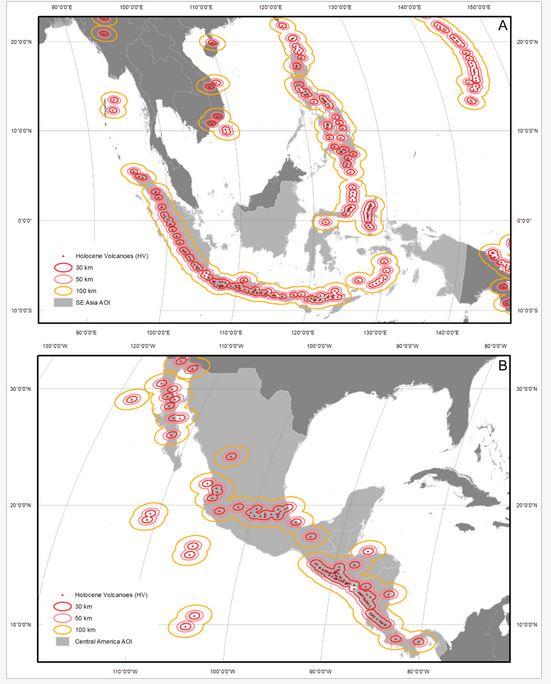
Further using the Global Human Settlement Layer, the JRC has also recently published a first global analysis of changes in built-up zones around volcanoes, shedding new light on where and whether volcanic risk is increasing or decreasing.
The scientists focused on Southeast Asia and Central America, two regions with many volcanic hotspots.
Results indicate that more than 8% of the world’s 2015 population lived within 100 km of a volcano with at least one significant eruption, and more than 1 billion people (14.3%) lived within 100 km of a Holocene volcano (a volcano active in the last 11 700 years), with human concentrations in this zone increasing since 1975 above the global population growth rate.
In last 40 years in Southeast Asia the highest population growth rates have occurred in close proximity to volcanoes (within 10 km), whereas in Central America these are observed farther away (beyond 50 km).

Disaster risk management tools
The JRC, supporting other Commission departments, operates the Copernicus Emergency Management Service.
It includes a vast portfolio of monitoring and visualisation tools for specific disasters such as forest fires (European Forest Fire Information System), floods (European Flood Awareness System), droughts (European Drought Observatory, Global Drought Observatory), and mapping of emergency situations from natural or man-made disasters.
Globally, droughts increasingly affect critical infrastructure, including public water supply, river transport and energy production, such as water for cooling.
In order to calculate the drought risk and vulnerability accurately, various geographic, climatic, social and economic factors need to be taken into account.
In September 2019, the JRC's global drought risk maps were included in the Drought Risk Assessment Visualisation Tool, which is a part of the Drought Toolbox by the United Nations Convention to Combat Desertification (UNCCD).
The Drought Risk Assessment Visualisation Tool provides drought stakeholders with easy access to resources to support action on drought preparedness with the aim to boost the resilience of people and ecosystems.

On the opposite end of the scale, there are floods. In order to calculate the flood risk in Europe, you need to take into account the combination of various geographic, climatic, social and economic factors.
While existing risk assessment tools are already sophisticated and cover several aspects, they are missing the effects of combined flooding from rain/rivers and high sea levels.
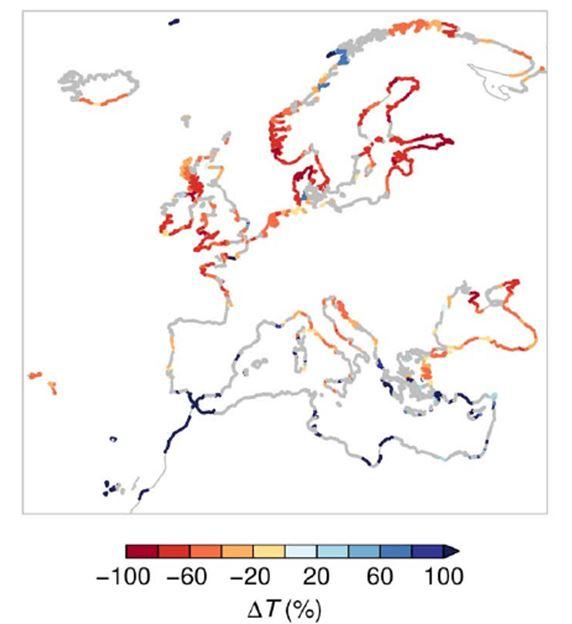
The JRC has contributed to the first analysis at European scale combining river and coastal flooding (called compound flooding), showing where combined impacts can affect coastal infrastructure such as ports or beaches.
According to the calculations, in a warmer future climate, the probability of compound flooding is projected to increase particularly along the west coast of Great Britain, northern France, the east and south coast of the North Sea, and the eastern half of the Black Sea.
The fraction of coastlines currently experiencing compound flooding at least every 6 years or more often than that is projected to increase from 3 to 11% by the end of the 21st century.

Natural hazard impacts on industry
Many hazardous industrial activities, such as refining, oil and gas production and transport, nuclear power generation or the preparation of rare specialty chemicals provide society with indispensable goods and services.
Unfortunately, these activities are vulnerable to natural hazard impact which can trigger so-called Natech accidents and the release of toxic substances, fires and explosions, potentially resulting in health effects, environmental pollution and economic losses.
The Fukushima nuclear accident in 2011 put Natech risks on the global agenda. Generally, Natech risks are bound to increase in the future due to human development (industrialisation, urbanisation) and climate change.
Some of the recent examples of natural hazard impacts on industry include the 2017 oil spills and chemical releases caused by Hurricane Harvey in Texas, or the 2013 landslide in Ecuador which damaged the Trans-Ecuadorian oil pipeline and resulted in a transboundary pollution incident.
In 2000 in Romania, in the Baia Mare accident, heavy rain and snowmelt coupled with design deficiencies led to the failure of a tailings dam, releasing large amounts of cyanide-laced wastewaters into rivers and polluting some 2000 km of the Danube River's catchment area.

In the EU major chemical accident risks are regulated by the so-called Seveso Directive on the control of major-accident hazards and its amendments.
About 30 years after its inception, the Directive now explicitly requires that environmental hazards, such as floods and earthquakes, be routinely identified and evaluated in an industrial establishment's safety document.
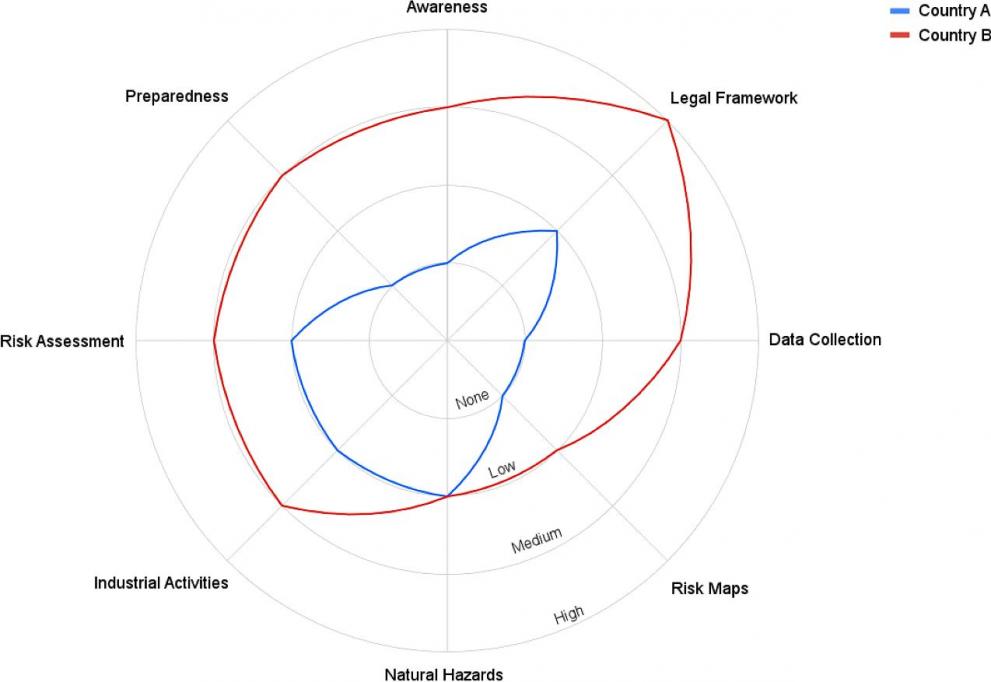
In a recently published study, the JRC has analysed the main factors that create Natech risk, and proposed simple indicators for gauging the level of Natech risk reduction and providing a measure for comparison across countries and time.
The parameters that matter for estimating a country's preparedness against natural hazard impacts on industry can be measured by the degree of: awareness and assessment of Natech risks, existence of a legal framework for Natech risk reduction, collection of accidents data, natural hazards considered, type of industrial activities that consider the Natech risk, availability of risk maps, extent of Natech preparedness.
Countries can use this tool for a simple self-assessment of their status.

Knowledge sharing and management
Last but not least, the JRC since 2016 has been operating the Knowledge Centre for Disaster Risk Management, which provides a networked approach to the science-policy interface in disaster risk management, across the Commission, EU Member States and the DRM community within and beyond the EU.
Details
- Publication date
- 14 October 2019
