What we do
We provide drought forecasting and monitoring maps, analysis tools and periodical reports.
Map, tools and reports are based on computation, forecasting and monitoring of key drought indicators, derived from satellite observations, hydro-meteorological models and in-situ data.
Our activities
Explore the drought situation in Europe and parameters such as rainfall, temperature, heatwaves, soil moisture, vegetation health, lowflow and groundwater availability.
Visualise the drought situation on the planet and for rainfall, soilmoisture, temperature, heatwaves, groundwater availability, soil moisture and vegetation response.
When severe droughts occur we publish ad-hoc reports detailing the situation, the forecasts and the impacts.
Find here a selection of our scientific publications on droughts.
Our latest news on droughts
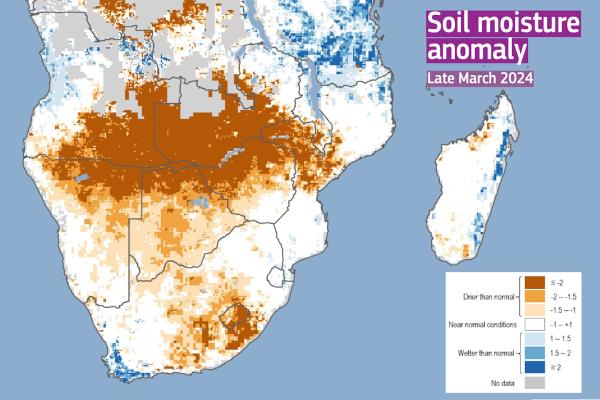
Southern Africa is currently facing an extreme environmental and humanitarian crisis as a severe drought takes a stronger hold on the region.
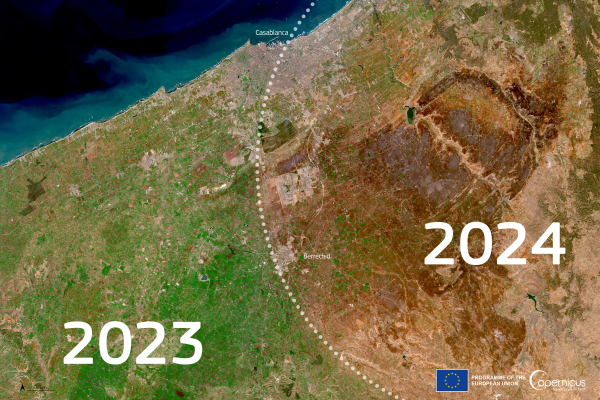
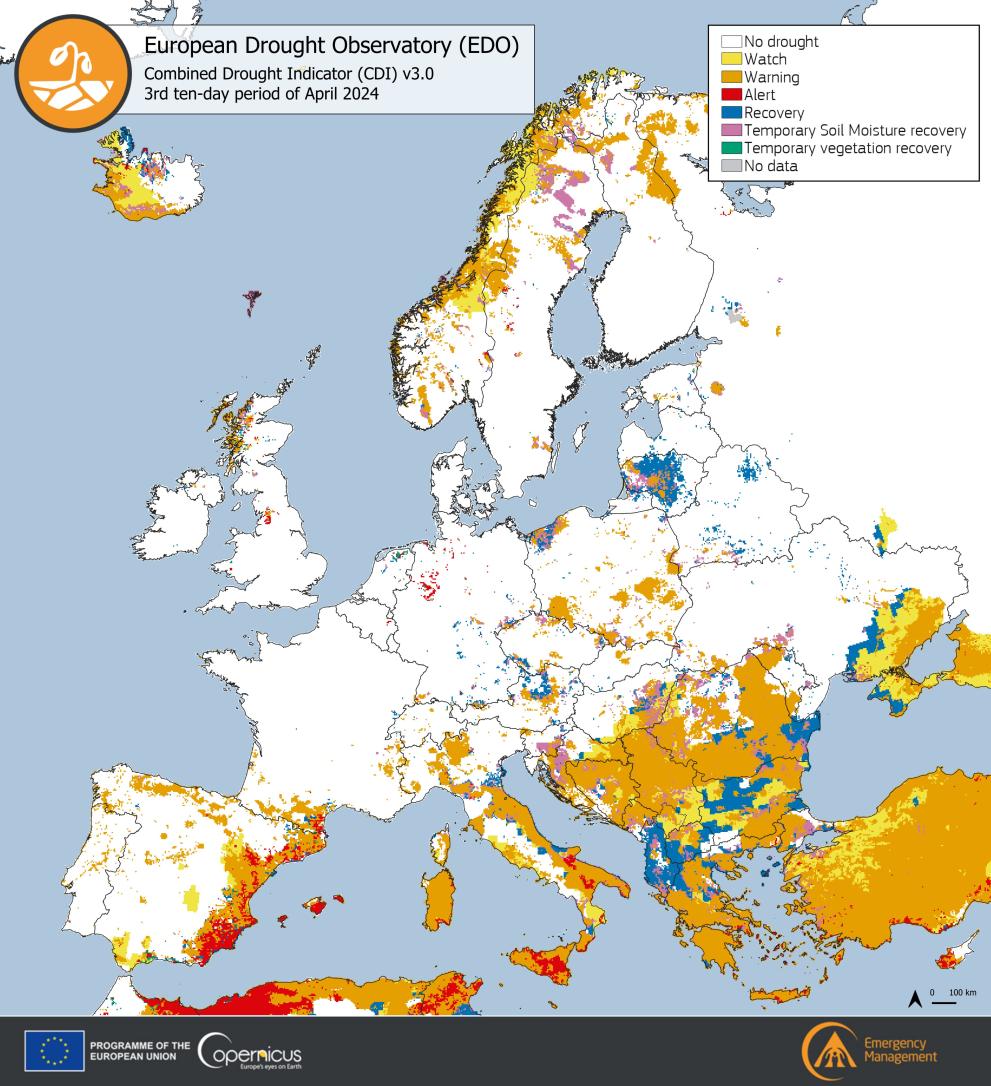
Severe and prolonged drought events have affected Europe for more than two years and northern Africa for six years, causing water shortages and hampering vegetation growth.
The European Drought Risk Atlas provides for the first time a comprehensive assessment and mapping of drought risks and impacts in the EU for a global warming of 1.5, 2 and 3 degrees.
What is drought?
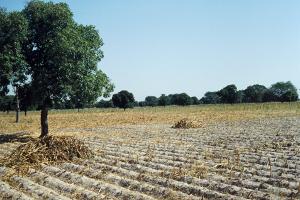
Drought is a climate extreme characterised by persistent unusual dry weather conditions affecting the hydrological balance. The conditions are usually associated with lack of precipitation, deficit in soil moisture and water reservoir storage, leading to widespread impacts. Droughts can be exacerbated by heatwaves.
Drought is to be distinguished from aridity, a long-term climatic feature, and from water scarcity, a situation where the available water resources are insufficient to satisfy water demand.
The exact definition of drought depends on several factors, such as the prevailing effects on the hydrological cycle, the economic, environmental, socio-economic sector analysed for its dependency of the availability of freshwater.
Drought Stages
Droughts are commonly grouped into three basic types:
- Meteorological drought: it is generally defined as a period of unusual precipitation deficit, in relation to the long-term average conditions for a region.
- Agricultural/Ecological drought: it occurs when a meteorological drought leads to a soil moisture deficit that limits water availability for natural vegetation and crops.
- Hydrological drought: it is associated with the effects of prolonged periods of precipitation deficit and reduced surface or sub-surface water. For instance, reduced streamflow in rivers and creeks, reservoir and lake level lowering as well as groundwater level lowering.
Drought monitoring
Due to the different types of drought and its intrinsic complexity, drought monitoring needs to rely on a set of different indicators, representing several components of the hydrological cycle (e.g. precipitation, soil moisture, reservoir levels, river flow, groundwater levels) or impacts (e.g. vegetation water stress). Usually, indicators represent statistical anomalies of the current situation with respect to the long-term climatology at a given location and period of time.
In order to ease the interpretation and to provide information for decision-making, individual indicators can be logically combined into high-level indicators that highlight different warning levels with respect to a given economic sector or the natural system. An example is the Combined Drought Indicator (CDI), for agricultural and ecosystem drought, as shown in the Copernicus European and Global Drought Observatories (EDO & GDO).
Users can get access to all available information by using the Copernicus EDO/GDO web mapping service.