These indicators are based on data provided by independent organizations, and made available through interoperable web-mapping services or ad-hoc integration into the European Drought Observatory (EDO) and the Global Drought Observatory (GDO). With these layers, users can deepen their analysis from continental scale to finer scales, test indicators and study drought-related phenomena and events at different scales or comparing different approaches.
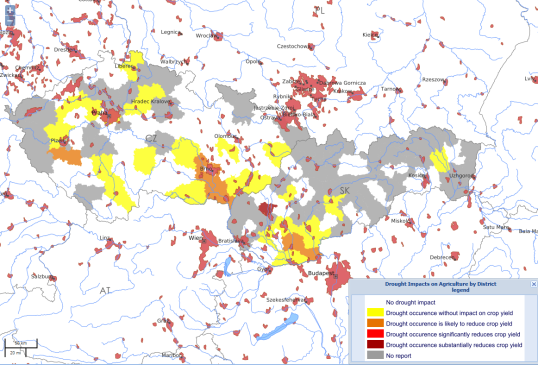
Example in Czechia and Slovakia of a Regional, National and Local Products visualisation within the European Drought Observatory.
The active Regional, National and Local products on EDO are:
Area: South-Eastern Europe
Standardized Precipitation Index SPI 1-, 3-, 6-, and 12-month accumulation period (monthly)
Drought Management Centre for Southeastern Europe DMCSEE
Area: Portugal
Standardized Precipitation Index SPI 3-, 6-, 9-, 12-month accumulation period (monthly)
Palmer Drought Severity Index PDSI Observed, monthly
Palmer Drought Severity Index PDSI Previews (monthly)
Instituto Português do Mar e da Atmosfera IPMA
Area: Rhine River Basin
Rhine gauge data Low Flow (daily)
International Commission for the Protection of the Rhine ICPR
Area: Ebro River Basin
Natural Drought (monthly)
Temporary Water Scarcity (monthly)
Confederación Hidrográfica del Ebro CHE
Area: Segura River Basin
Temporary Water Scarcity (monthly)
Basin System Status Index [ 2004-2018]
Natural Drought (monthly)
Confederacion Hidrografica del Segura CHS
Area: Czechia and Slovakia
Drought Intensity (weekly)
Drought Impacts on Agriculture by District (weekly)
Area: Romania
Daily Soil Moisture Reserve (10-day)
Average Daily Soil Temperature (10-day)
Agrometeorological Department of MeteoRomania
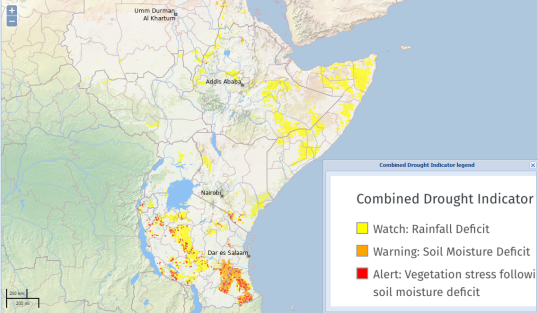
For the Global Drought Observatory GDO, a Combined Drought Indicator CDI over East Africa is provided by the East Africa Drought Watch (IGAD Climate Prediction and Application Centre).
Visualization on GDO of the Combined Drought Indicator CDI provided by the East Africa Drought Watch (ICPAC) .


