What is PVGIS?
PVGIS is a web site that gives you information about solar radiation and PhotoVoltaic (PV) system performance. You can use PVGIS to calculate how much energy you can get from different kinds of PV systems at nearly any place in the world.
This page is meant to give you an introduction to using PVGIS. There is a lot more information about PVGIS, for instance go here to learn more about how PVGIS calculations are made.
PVGIS, first look
The PVGIS web interface looks like this:

There are many options in PVGIS, and for most of them you can get help by clicking on the text of the option. For instance, if you click on the text "Lat/Lon" below the map, you will get a help text on that topic.

At this point you can't make any calculations because you have not yet chosen the place for which you want to calculate! You can choose a place in three different ways:
- By clicking on the map (you can zoom in and move around in the usual way).
- By entering the name of a place (town, street) in the "Address" field below the map.
- By writing the latitude and longitude coordinates in the boxes below the map.
The next figure shows you where to find these three options in the interface.

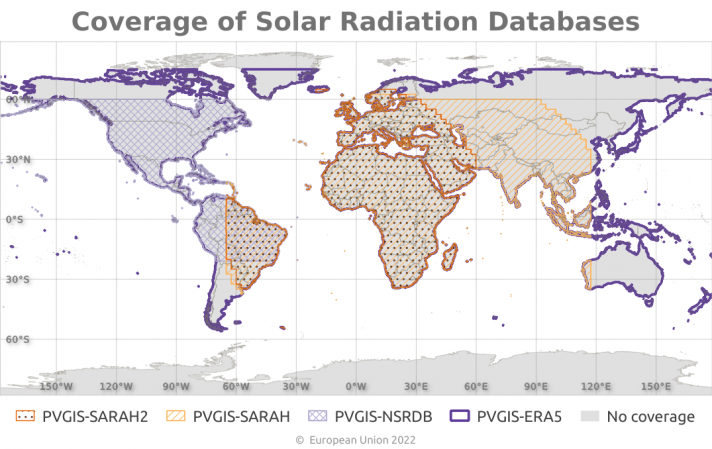
In some areas we don't yet have the necessary data, especially solar radiation data. If you choose a place where there are no data, you will get a message in red to the right of the map, saying "Location without data". In some areas we have data on the terrain but not solar radiation, so you can download the horizon height but nothing else. Then the warning will be: "Location without radiation data. Just horizon data available". The next shows a map of the extent of the different solar radiation data sets used in PVGIS.
Choosing type of calculation
You can make several different types of calculations with PVGIS. You choose which type by selecting one of the tabs to the right of the map (next figure). For each of the calculation types you can get help by clicking on the title of the calculation tab.

At the moment the calculations that can be made with PVGIS are:
- Performance of grid-connected PV Here you can calculate the long-term average energy output from PV systems that are connected to the electricity grid so that the energy produced can be used locally or sent to the grid. This works for fixed PV systems, where the PV modules are mounted in a fixed position, either on a free-standing rack or on a building.
- Performance of tracking PV systems Here you can calculate the long-term average energy output from grid-connected PV systems where the modules are put on a sun-tracking mounting so the modules receive more sunlight. You can choose between a number of different types of tracking systems.
- Performance of off-grid PV systems This tool allows you to make calculations on PV systems that are not connected to the electricity grid but use batteries as energy storage.
- Monthly radiation With this tool you can get monthly average radiation and temperature data for each month over a range of years.
- Daily radiation Here you can calculate the average solar irradiance and temperature during the day for an average day in each month.
- Hourly radiation This tool lets you download a time series of hourly solar radiation and/or PV power values.
- TMY A tool to generate Typical Meteorological Year (TMY) data of solar radiation, temperature and other meteorological data, used in many fields, for instance in the calculation of the energy performance of buildings.
Getting results!
For each of the calculation types you have to enter some information about the type of calculation you want to make. Once you have done this, you can do one of two things:
- You can see the results of the calculation as graphs and numbers in the PVGIS web page. The results will appear below the map and input fields.
- You can download the calculated data in CSV format, suitable for use with spreadsheets and other software. The formats of the downloaded data for each of the calculation options are described here.
The general way to do this is to just click on one of the two buttons at the bottom of each calculation tab.

There are a couple of exceptions to this. The hourly time series calculation will give you so much data that it doesn't make sense to try to make graphs of the data. In this case there is only the option to download CSV data. For the TMY data you can download the data in two different formats. One is a normal CSV file, while the other is in the EPW format (strictly speaking this is still CSV) which is used for the EnergyPlus software.
The results shown in the web page consists of graphs and statistical data, such as yearly averages. In many of the graphs you can see the values by letting the mouse hover above the graph. The graphs can be downloaded as graphics files (PNG format). It is also possible to get the output as a PDF file, showing graphs and tables of the values used to produce the graphs.