- Contributes to EC priorities:
Background
Sustainability has become a top priority in the European Commission policy activities since President Ursula von der Leyen has promised to broaden and strengthen EU climate policy (von der Leyen, 2019) through a European Green Deal. In about 20 different initiatives, the Commission included proposals on a reduction target from 40 to 55 percent of the EU’s emissions by 2030, the introduction of a carbon border tax, the drafting of a Sustainable Europe Investment Plan, the partial transformation of the European Investment Bank (EIB) into a climate bank, the extension of the EU emissions trading system (ETS) and the development of a new industrial policy for Europe (von der Leyen, 2019a) .
In this context, the telecom industry has also committed itself to reduce energy consumption and greenhouse gas emissions. Since the need for high performance networks constantly increases, the energy efficiency of those networks needs to be improved.
In order to quantify the environmental impact of the telecommunication networks, a common set of indicators needs to be developed. A first step for its development was the survey conducted in the first half of 2023 and is described below.
Survey on sustainability indicators in telecommunication networks
The objective of the survey was to collect inputs on sustainability indicators from stakeholders involved in the design, development, deployment and operation of telecommunications networks providing communication services to both commercial and residential customers.
More specifically, the survey was an essential instrument for the identification of common indicators for measuring the sustainability of electronic communications networks (ECNs) and for the provision of electronic communications services (ECSs).
The findings from the survey will be used to assess the current state of the art in the adoption of sustainability indicators, prioritise the choice of the main indicators and prepare the ground for a Code of Conduct (CoC) on the sustainability of telecommunications networks.
The survey was open from 26/5/2023 to 23/6/2023.
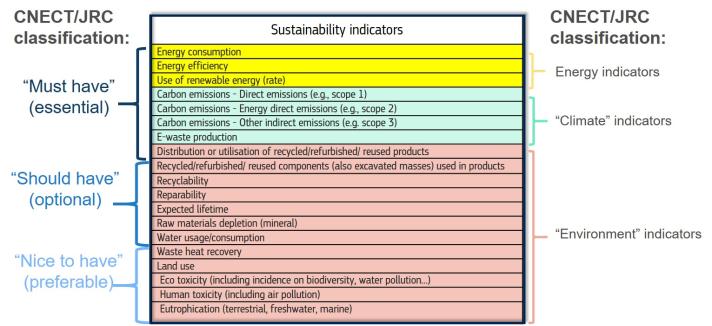
An initial prioritization of the indicators was defined by DG CNECT and DG JRC and it is reported here:
The survey was built on existing work by BEREC , IDEA, Öko-Institut, ARCEP, ADEME, GSMA, and others.
The feedback from the stakeholders is supposed to help identify the acceptance and existing gaps regarding sustainability indicators (e.g., standardisation and uniformity).
Survey Questions
The survey questions were defined in the following main classes:
- Identification of respondent
- Acceptance of each sustainability indicators
- For the indicators identified as “must have” by the respondent:
- Standards/guidelines used
- Standardisation maturity and gaps
- Auditing (e.g., mandatory, voluntary)
- Level of the network (RAN, fixed access, backbone, data centers for telecom, organisation, facilities)
- Complexity and cost of implementation
- Metrics
- For network operators only: relevance of energy indicators in purchases and in Corporate Social Responsibility reports
- For auditors only: uniformity of the indicators (high/medium/low)
Survey Results Charts
Some examples of survey results are presented here. All the survey results are presented in the upcoming technical report, which will be published in the first quarter 2024.
Survey Results tables
Question: should the proposed “Must Have” indicators be classified as:
- MH: “Must have”
- SH: “Should have”
- NH: “Nice to have”
|
|
(MH) Energy consumption |
(MH) Energy efficiency |
(MH) Use of renewable energy (rate) |
(MH) Carbon emissions - Direct emissions (e.g., scope 1 emissions) |
(MH) Carbon emissions - Energy indirect emissions (e.g., scope 2 emissions) |
(MH) Carbon emissions - Other indirect emissions (e.g., scope 3 emissions) |
(MH) E-waste production |
(MH) Distribution or utilisation of recycled/ refurbished/ reused products |
|
MH |
98% |
89% |
80% |
91% |
89% |
76% |
80% |
67% |
|
SH |
2% |
4% |
7% |
2% |
7% |
13% |
11% |
22% |
|
NH |
0% |
7% |
13% |
4% |
4% |
11% |
9% |
11% |
|
|
(SH) Recycled/refurbished/ reused components (also excavated masses) used in products |
(SH) Recyclability |
(SH) Reparability |
(SH) Expected lifetime |
(SH) Raw materials depletion (mineral) |
(SH) Water usage/ consumption |
|
MH |
20% |
20% |
24% |
28% |
15% |
22% |
|
SH |
59% |
72% |
72% |
63% |
65% |
59% |
|
NH |
20% |
9% |
4% |
9% |
20% |
20% |
|
|
(NH) Waste heat recovery/ reuse |
(NH) Land use |
(NH) Eco toxicity (including incidence on biodiversity, water pollution…) |
(NH) Human toxicity (including air pollution) |
(NH) Eutrophication (terrestrial, freshwater, marine) |
|
MH |
9% |
11% |
13% |
13% |
11% |
|
SH |
17% |
15% |
11% |
13% |
7% |
|
NH |
74% |
74% |
74% |
72% |
80% |