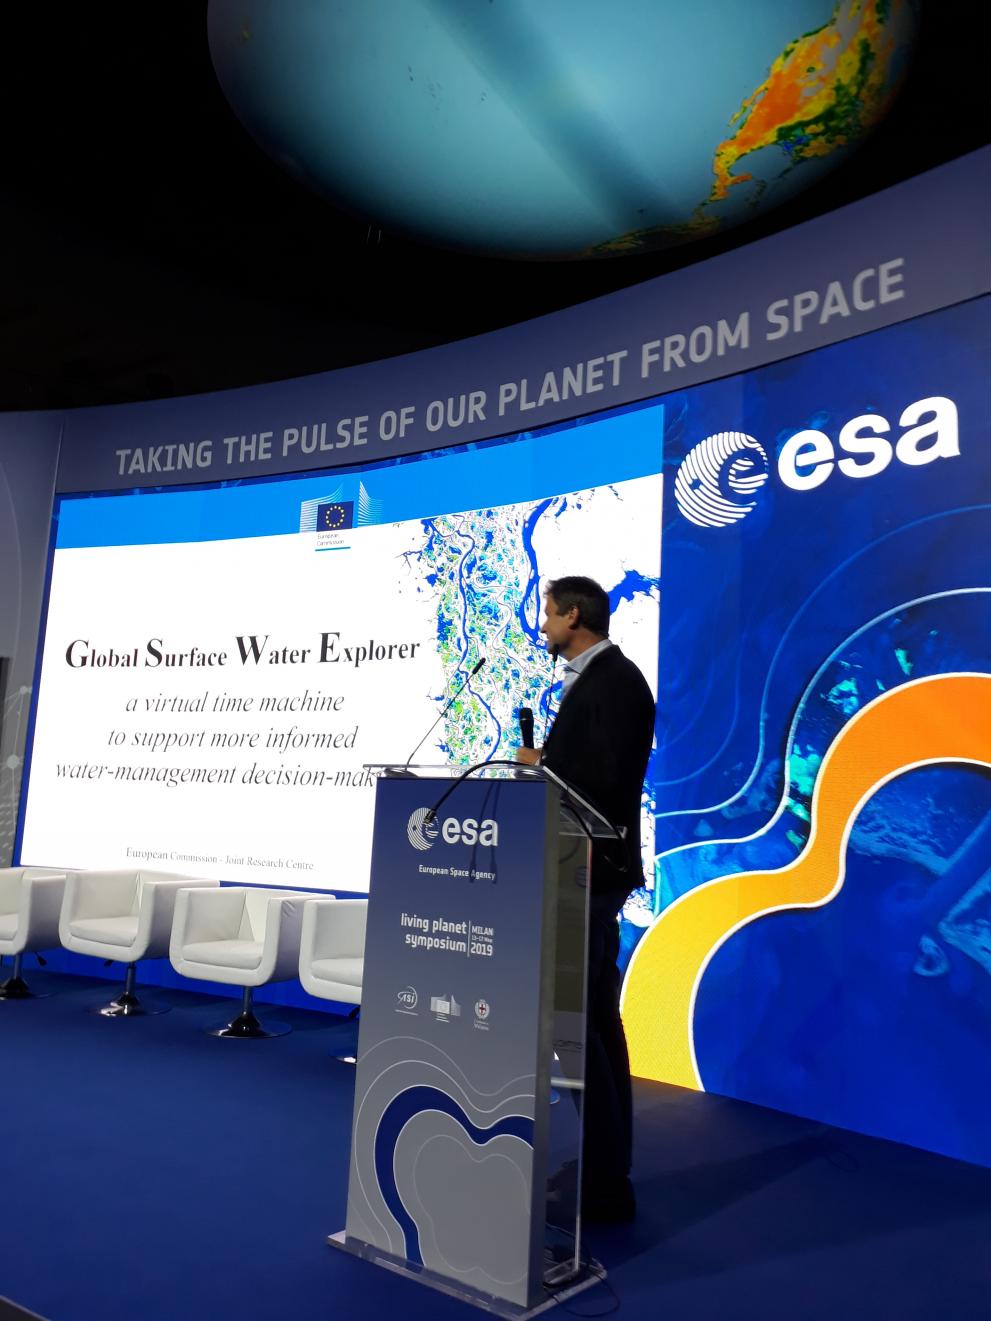
An updated version of the Global Surface Water Explorer was launched at the Living Planet Symposium in Milan last month.
First launched in 2016, this free-to-use interactive online platform now maps the dynamics of the Earth's surface water over the past 35 years.
Global Surface Water Explorer
The Global Surface Water Explorer (GSWE) is a "virtual time machine" that maps and provides statistics on the location, distribution, extent and changes over time of the world's surface waters from 1984 to 2018.
Users can scroll back in time to measure the changes in the location and persistence of surface water. The validated dataset behind the Explorer is globally and temporally consistent, and also locally relevant thanks to its 30-m spatial resolution. The maps are available for all users, free of charge.
JRC scientists mined almost 4 million Landsat satellite images of the entire planet to map the extent of and changes in global surface water over time, and visually verified forty thousand validation samples. This Big Data processing was powered by the cloud computing facilities of Google Earth Engine.
What the GSWE can be used for
Where and when water is found on the planet’s surface is hugely important as it influences the climate system, the movement of species, sustainable development and social, institutional and economic security.
Providing a long-term history of the water-surface of the planet, the Explorer is an extremely powerful tool that helps understand the consequences of climate change and past decisions, and informs decisions on water management, climate modelling, biodiversity conservation and food security.
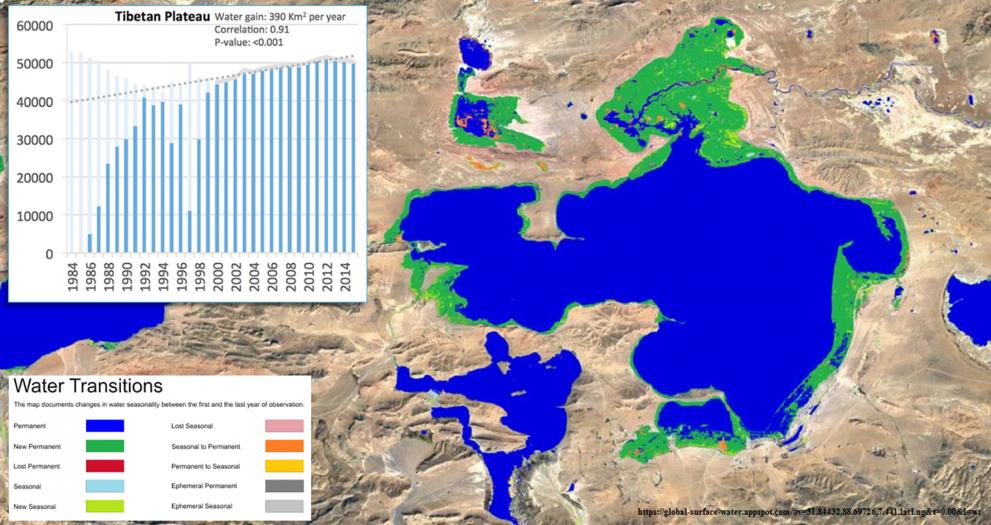
For example, it shows how the Himalayan glaciers are melting due to rising temperatures in the Tibetan plateau (known as the "third pole") have increased lakes in area by 20% with respect to the 1980s, flooding precious grazing land and threatening transport links.

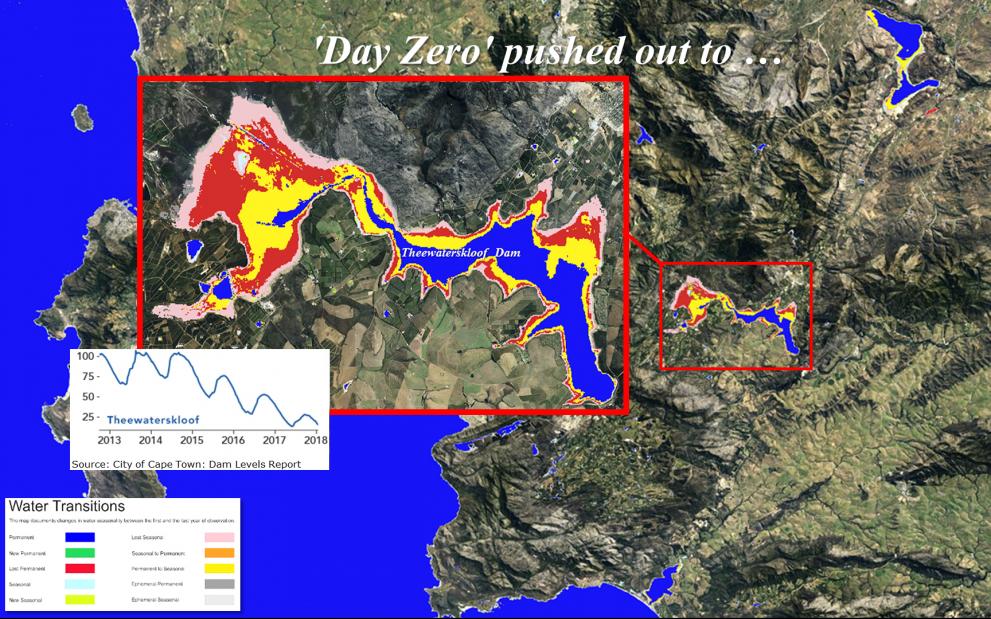
The Explorer is also used to monitor the consequence of drought events on water surface availability, such as the recent drought situation in Cape Town, where water levels dropped significantly in the main reservoir (the Theewaterskloof Dam) between 2015 and 2018 to the point where the government considered turning off the taps.

GSWE: First Official SDG indicator
On World Water Day (22 March) this year, the GSWE dataset was officially endorsed by the United Nations as the official indicator for monitoring progress towards target 6.6 (Ecosystems) of the Sustainable Development Goals (SDGs).
This indicator - SDG indicator 6.6.1 - seeks to track changes in the extent of water-related ecosystems over time, stop the degradation and destruction of water-related ecosystems, and assist the recovery of those already degraded.
The indicator 6.6.1 GSWE monitoring methodology was approved by the Inter Agency Expert Group on SDGs as a Tier I classification. This is the highest classification an indicator methodology can reach and is testament to the scientific excellence of the Explorer and, more generally, to the legacy of over 40 years of satellite observations.
Future inclusion of Sentinel data
The current set of global maps is based on 30-metre resolution data from NASA/US Geological Survey Landsat satellites, with an 8-day revisit frequency.
The inclusion of Sentinel- 1 and Sentinel-2 radar and optical satellite imagery from the EU's Copernicus Programme will further increase the spatial resolution of the dataset to about 10 metres, and increase the frequency of observations to once every 3 days.
The JRC is also monitoring and mapping the volume dynamics of all reservoirs in the world, which will further enhance the knowledge available to inform decision-makers and planners.
Further information
- Global Surface Water Explorer
- Water-Related Ecosystems platform
- Monitoring our Blue Planet: First SDG indicator platform launched by Google, the JRC and UN Environment
- High-resolution mapping of global surface water and its long-term changes
- How do lakes and reservoirs behave across decades?
- Mapping long-term global surface water occurrence
Related Content
Water-Related Ecosystems platform
High-resolution mapping of global surface water and its long-term changes
Details
- Publication date
- 20 June 2019
