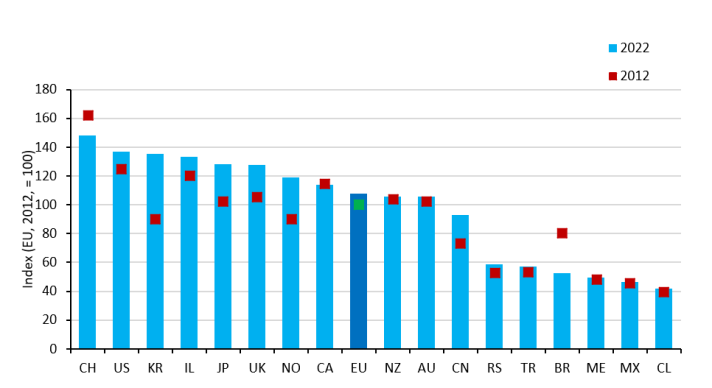
The European Union outperforms New Zealand, Australia, and China in terms of innovation output, but still lags behind countries like Switzerland, the United States, and South Korea. This is the latest finding published in a JRC report on the Innovation Output Indicator (IOI), a composite indicator that measures innovation performance for 46 countries including EU Member States, the EU bloc as a whole, and selected EFTA, OECD and emerging economies. The index feeds into the European Commission’s Science, Research and Innovation Performance of the EU report published today, which analyses research and innovation dynamics and Europe's performance on science and innovation.
According to the JRC report on the IOI, the EU recorded an 8% increase in its IOI between 2012 and 2022. This marks an improvement in innovation output performance, which is comparable to those reported by the US (10%) or Israel (11%). By contrast, China reported a nearly 30% IOI improvement in the same period and looks poised to soon close the innovation gap with the EU.
Differences among EU Member States
Sweden and Germany are the best performers in the EU, followed by Finland and Ireland. Sweden is particularly strong in terms of intellectual property applications. Germany, on the other hand, is the country that depends the least on foreign inputs in the manufacturing sector: over half of the value of its knowledge-intensive exports is domestically generated. Conversely, Romania, Latvia and Poland reported the lowest performances among EU Member States.
Intellectual property applications are on a downswing
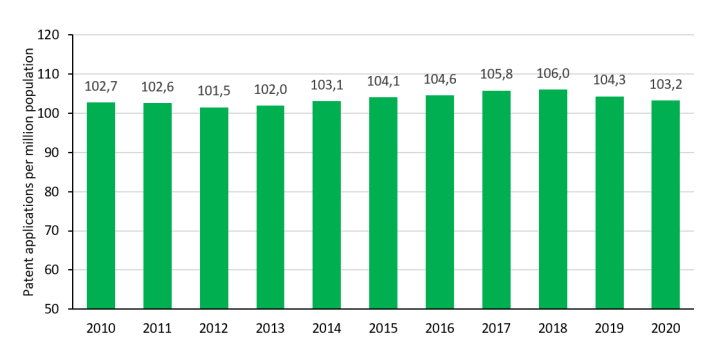
Patent applications are a useful indicator to compare innovation performance between countries, as they result from innovation activities and are standardised worldwide. On this front, the EU is not performing very well: following a peak in 2018, the number of patent applications (per million population) in the EU has declined slightly in 2019 and 2020, reaching the lowest level since 2012-2013. Korea and Japan lead the ranking for this indicator, while China registered the largest improvement between 2012 and 2020.
Shifting towards knowledge-intensive activities
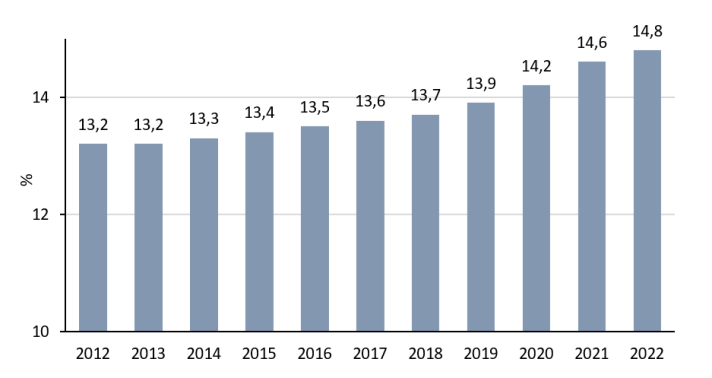
The share of employment in knowledge-intensive industries (such as ICT or pharmaceutical sectors) is another useful indicator, as it shows how much of a country’s economy is pursuing innovation actively. In the EU, this indicator has increased during the previous decade, reaching a share of 14.8% in 2022 (up from 13.2% in 2012). While the EU economy is clearly shifting towards knowledge-intensive activities, it is still far behind the US, where the share in the same period was close to 20%.
EU autonomy in service exports is still low, but is improving quickly
The IOI also includes a country’s share of domestic value added in knowledge-intensive exports. As most of today’s exports are not fully produced in the exporting country, their gross value incorporates a certain share of value added by other countries in imported intermediates. Because of this, looking at gross export value is not always an effective way to assess a country’s competitiveness. The share of domestic value added in exports provides a better indication of a country’s technological capabilities and highlights possible foreign dependencies in the production of goods and services for export.
The IOI analyses manufacturing and services exports separately, as countries often perform very differently in these two sectors. Understanding these differences helps to develop effective industrial and innovation policy to strengthen the EU’s resilience in key sectors and reduce its dependency on third countries for strategic technologies and supply chains.
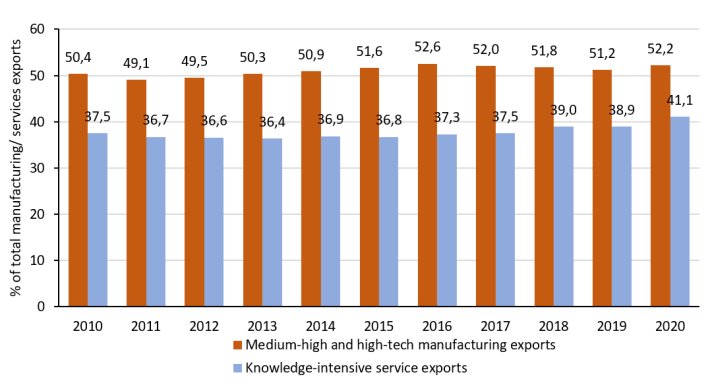
The EU relies less on foreign inputs in the manufacturing sector, where the value of its medium-high and high-tech exports produced domestically was over 50% in 2020, similarly to the US and Korea. By comparison, the value of its knowledge-intensive service exports produced domestically was close to 40% in the same year. However, EU autonomy in services is improving more than twice as fast than in manufacturing.
Background
The annual JRC report on the IOI is part of the INNOVA MEASURE VI project. The aim of the project is to provide a continuous assessment of cross-country innovation performance and policy-relevant evidence on the contributions and drivers of science, technology and innovation.
The next instalment of the IOI report is going to feature a regional level (NUTS2) analysis of EU Member States, to help monitor regional disparities in innovation outputs and contribute to the discussion on the functioning of regional innovation systems.
The Innovation Output Indicator is one of the key indicators used in the Science, Research and Innovation Performance of the EU (SRIP) report to assess EU’s innovation performance. The SRIP report is a biennial report that takes a broad perspective to analyse EU research and innovation across several dimensions. The 2024 edition of the SRIP report has been published today.
Details
- Publication date
- 27 June 2024
- Author
- Joint Research Centre
- JRC portfolios