1. Introduction to solar radiation
The solar radiation that reaches the top of the atmosphere on a perpendicular plane to the rays, known as solar constant, has an average value of 1361-1362 W/m2 which varies somewhat depending on the position of the Earth in its elliptical orbit.
As the solar radiation goes through the atmosphere it suffers different processes of absorption, dispersion or scattering that result in lower levels of solar radiation being received at the Earth's surface. These are due to the atmosphere components, such as ozone or CO2, and solid and liquid particles in suspension like aerosols or water vapour. However, the main source of attenuation is the cloud cover. Not only the broadband value is different, but also these processes of absorption and attenuation affect differently the wavelengths of solar radiation, so the spectral distribution of the solar radiation at ground level differs from the extraterrestrial one.
The solar radiation received at ground level, known as global radiation is sum of three components. The first one, named beam or direct radiation, is the fraction of the solar radiation that reaches the ground without being attenuated by the atmosphere and can be modelled as coming directly from the solar disc. The second part or diffuse is the solar radiation that reaches the ground after being reflected or scattered by the atmosphere and is considered to arrive from the whole sky dome. The third component, not always taken into account, is the reflected radiation from the ground surface or nearby obstacles. The beam component is only available when the solar disc is not blocked by clouds, while the diffuse component is always available, being the only radiation available whenever clouds block the solar disc.
Solar radiation under clear sky conditions (without clouds) and clean and dry atmosphere is a very important parameter as it provides information about the maximum radiation available at any location. This value is normally modelled and is used as input data for other models applied for the estimation of the solar radiation at normal atmospheric conditions.
Through the pages of PVGIS web, we talk about solar radiation and use it in a generic way but we also use other terms that should be explained. Concepts like irradiance and irradiation should be clarified. Irradiance is the solar power falling into a surface per unit area and unit time. It is therefore expressed in W/m2. While irradiation is the amount of solar energy received per unit area during a period of time, therefore energy and it is expressed in Wh/m2. The data provided by PVGIS contains both irradiance and irradiation values.
1.1 Estimating the solar radiation intensity
There is little doubt that the very best way to measure solar radiation is to use high-quality sensors on the ground. But to be useful, these measurements should fulfill a number of conditions:
- Only high quality measurement sensors should be used.
- Measurements should be performed at least every hour.
- Sensors should be calibrated regularly.
- Sensors should be cleaned regularly.
- Data should be available for a long time period, preferably 10 years or more.
The number of ground-based radiation measurements that fulfill all these criteria is relatively low and the stations are often spaced far apart.
For these reasons it has become more and more common to use satellite data to estimate the solar radiation arriving at the earth surface. Mostly these methods use data from geostationary meterological satellites. The advantages of using such data are:
- solar radiation data are then available in the whole of the area covered by the satellite images, for instance, the METEOSAT satellites cover Africa, Europe and most of Asia up to about 60°N, with an image resolution of a few kilometers.
- normally long time series are available, up to 30 years or more.
The disadvantage of using satellite data is that the solar radiation at ground level must be calculated using a number of fairly complicated mathematical algorithms which use not just satellite data but also data on atmospheric water vapour, aerosols (dust, particles) and ozone. Some conditions can cause the calculations to lose accuracy, for example:
- snow which can be mistaken for clouds
- dust storms which can be difficult to detect in the satellite images
Geostationary satellites also have the limitation that they don't cover polar areas. Nevertheless, the accuracy of satellite-based solar radiation data is now generally very good. For this reason, most of the solar radiation used in PVGIS are based on the satellite algorithms.
Another source of solar radiation estimates is from Climate Reanalysis Data. Reanalysis data are calculated using numerical weather forecast models, re-running the models for the past and making corrections using the known meteorological measurements. The output of the models is a large number of meteorological quantities, often including the solar irradiance at ground level. Several of these data sets have global coverage, including the polar areas where the satellite methods do not have data. The disadvantages of these data sets is that they mostly have low spatial resolution (one value every 30km or more), and that the accuracy of the solar radiation values generally is not as good as the satellite-based solar radiation data over the areas covered by both types of data sets.
For the release of PVGIS 5.2 we are making use of the following reanalysis-based solar radiation data sets:
- ECMWF ERA-5, produced by the European Centre for Medium-range Weather Forecast (ECMWF). This data set has global coverage at a resolution of about 30km, and includes both global and direct solar irradiance. At the time of writing, only the time period 2005-2020 has been in PVGIS along with global coverage.
More information about the new reanalysis-based solar radiation data can be found here.
1.2 Calculation of solar radiation from satellite data
The methods used in PVGIS have been described in a number of scientific papers ( Mueller et al., 2009, Mueller et al., 2012, Gracia Amillo et al., 2014). Here we will only give a brief outline of our implementation of these. This description is for the calculations of solar radiation over Eurasia and Africa (the PVGIS-CMSAF and PVGIS-SARAH databases). The data from the NSRDB data set have been calculated using different methods (Habte et al., 2017).
The first step in the calculation is to use the satellite images to estimate the influence of clouds on the solar radiation. Clouds tend to reflect the incoming sunlight so that less radiation arrives at the ground.
The reflectivity of the clouds are calculated by looking at the same satellite image pixel at the same time every day in a month. The method then assumes that the darkest pixel in the month is the one that corresponds to clear sky (no clouds). For all the other days the cloud reflectivity is then calculated relatively to the clear-sky day. This is done for all hours in the day. In this way, an effective cloud albedo can be calculated. The figure below shows an example of the raw satellite image and the effective cloud albedo calculated from the image. Notice how the land surfaces are visible in the first image but in the second only the clouds are left.
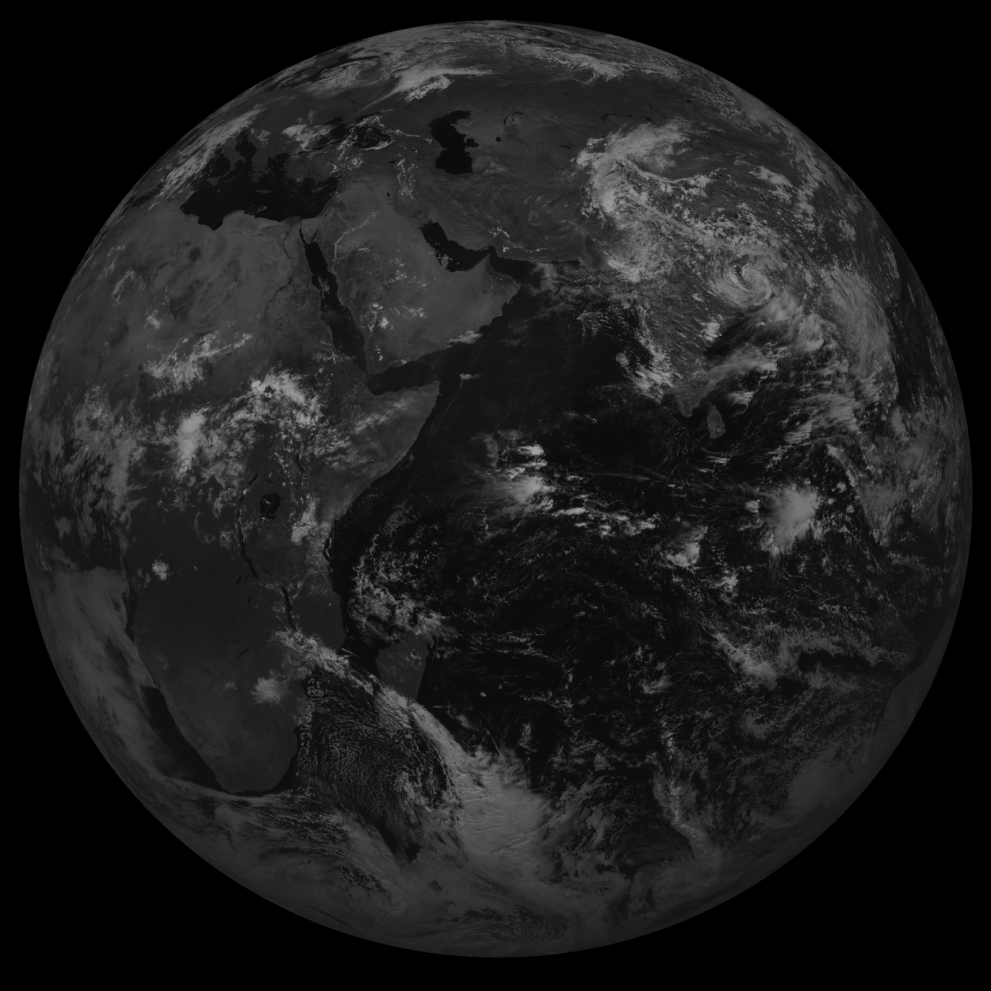
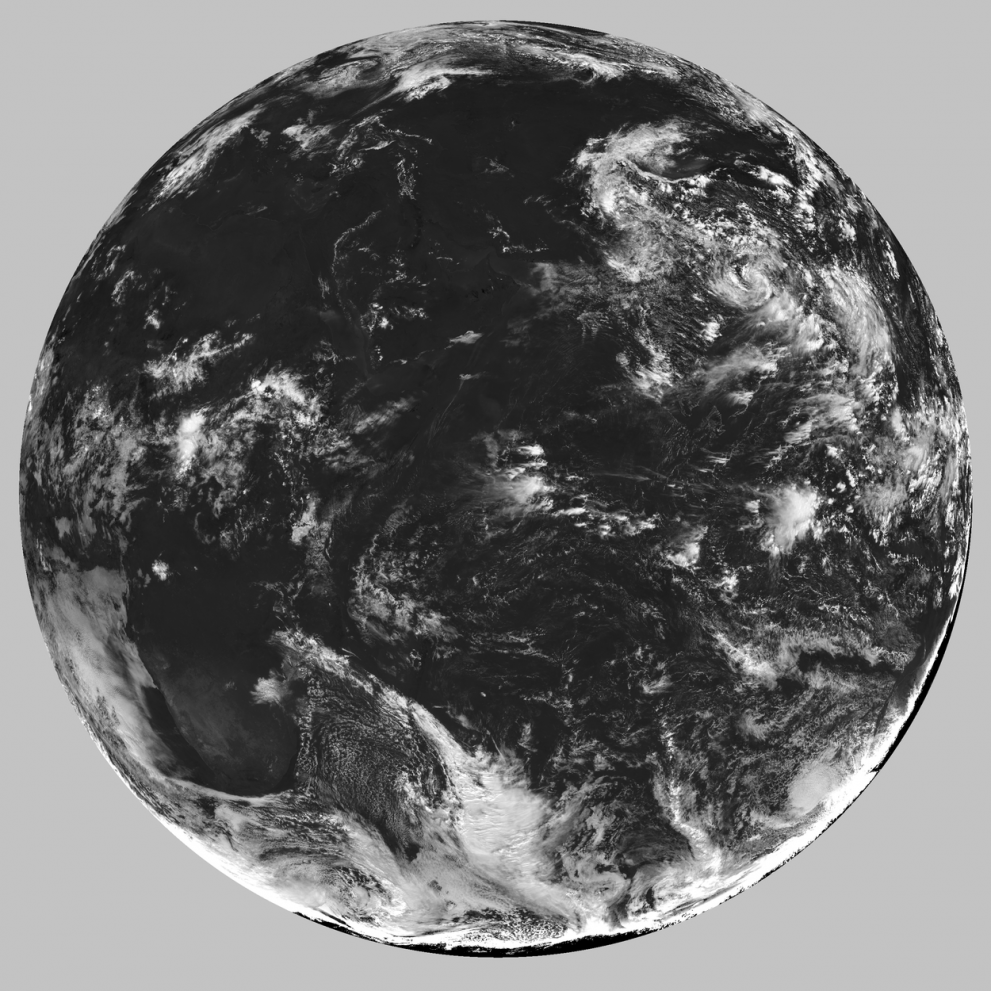
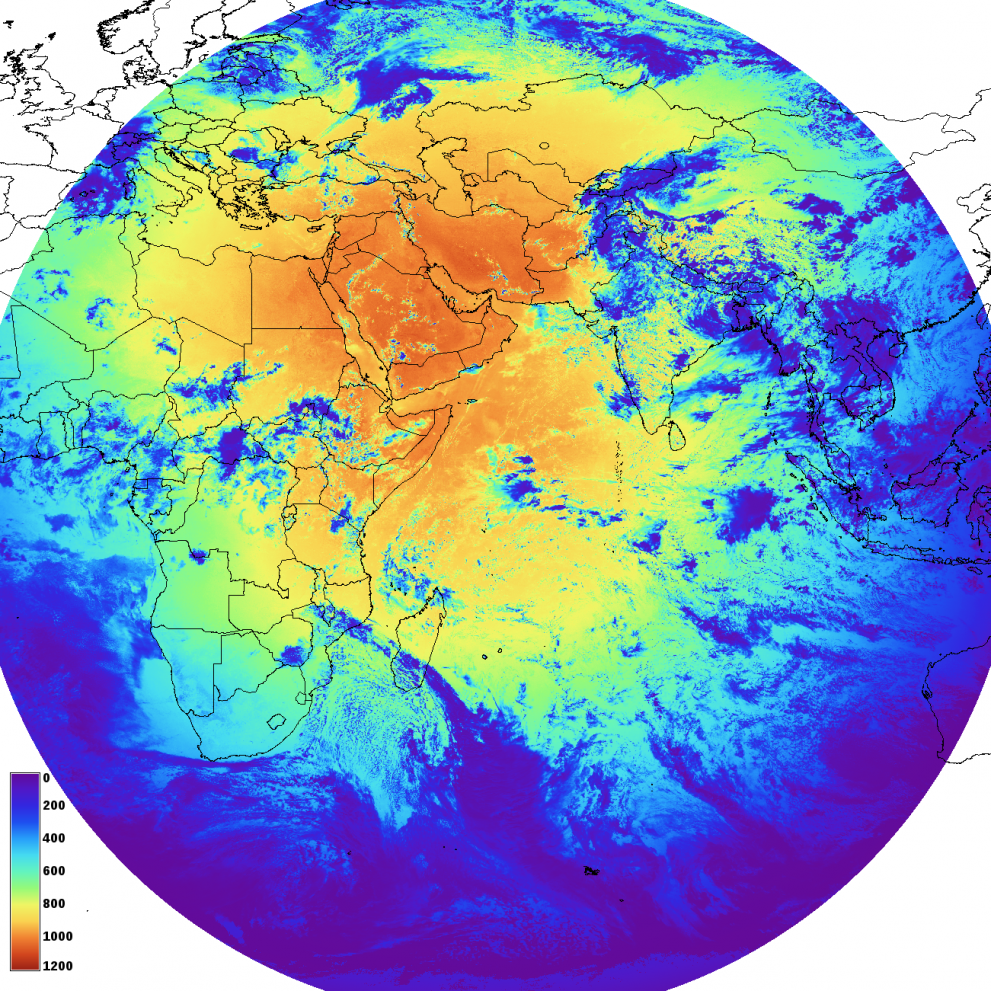
In a second step the method calculates the solar radiation at clear sky conditions (i.e. no clouds) using the theory of radiative transfer in the atmosphere together with data on how much aerosols (dust, particles, etc.) there are in the atmosphere and the concentration of water vapour and ozone, both of which tend to absorb radiation at particular wavelengths. The total radiation is then calculated from the cloud albedo and the clear-sky irradiance. The image below shows the global horizontal irradiance calculated using the cloud albedo shown in the image above.
The method generally works well but may fail in some cases. For instance, if there is snow on the ground this may be seen as clouds by the method which then calculates too low irradiance. Also, the aerosol information used for the calculation consists of averages over many years, so short-term changes in aerosols, for instance due to dust storms or volcanic eruptions are not so well captured by the method.
For the present version of PVGIS, the satellite data used for the solar radiation estimates are from the METEOSAT satellites covering Europe, Africa and most of Asia. Depending on the type of satellite, images are captured every 15 minutes or 30 minutes. For PVGIS we have used one image per hour. The resolution of the satellite images varies, it is highest just below the satellite (nadir) and decreases when moving towards the edge of the image. At nadir the resolution is about 4km.
1.3 Data availability
The algorithms used for the satellite-based solar radiation data present in PVGIS have been developed within the CM SAF collaboration. The solar radiation data used in PVGIS are also available directly from CM SAF via the web user interface.
Recently we have collaborated with the National Renewable Energy Laboratory to include the NSRDB data into PVGIS. This extends the coverage to North and Central America.
2. Validation of the satellite-based solar radiation data
The solar radiation data produced from the satellite images must be checked against measurements at ground level to get an idea of how large uncertainty there is in the satellite-based solar radiation data. This is known as the validation of the data.
A number of scentific papers have presented validation results for the satellite solar radiation data used in PVGIS by comparing with ground station measurements (Mueller et al., 2009, Mueller et al., 2012, Huld et al., 2012, Gracia Amillo et al., 2014, Gracia Amillo et al., 2021). Here we will only present the basic results of the validation. Most of the ground station measurements are from the Baseline Surface Radiation Network (BSRN), which provide high-quality solar radiation measurements for stations across the world.
The hourly values of global horizontal (W/m2) from SARAH 2 have been validated against ground measurements from a selected set of BSRN ground stations. The BSRN minute data have been preprocessed before being used in the validation. For the comparison against the “instantaneous” satellite-based data (derived from single image processing), the measurements taken during the ten-minute interval centered at the time of the satellite image have been averaged to obtain the measured value to be used for the validation. The table below shows the results of the absolute mean bias difference MBD (W/m2) and the root mean square difference (RMSD, W/m2) for the selected ground stations and time range.
|
Station |
Latitude |
Longitude |
MBD (W/m2) |
RMSD (W/m2) |
Year0 - YearN |
|---|---|---|---|---|---|
|
Cabauw (NL) |
51.9711 |
4.9267 |
1.3 |
86.9 |
2005-2020 |
|
Camborne (UK) |
50.2167 |
-5.3167 |
-1.6 |
74.3 |
2005-2017 |
|
Carpentras (FR) |
44.0830 |
5.0590 |
6.7 |
56.5 |
2005-2018 |
|
Cener (SP) |
42.816 |
-1.6010 |
7.0 |
85.2 |
2009-2020 |
|
De Aar (SA) |
-30.6667 |
23.9930 |
3.3 |
79.6 |
2005-2020 |
|
Eastern North Atlantic (PT) |
39.0911 |
-28.0292 |
2.0 |
65.8 |
2015-2015 |
|
Florianopolis (BR) |
-27.6047 |
-48.5227 |
4.3 |
112.2 |
2013-2020 |
|
Gobabeb (NA) |
-23.5614 |
15.0420 |
3.3 |
60.8 |
2012-2020 |
|
Izaña (SP) * |
28.3093 |
-16.4993 |
-68.7 |
176.5 |
2009-2020 |
|
Lindenberg (DE) |
52.2100 |
14.1220 |
2.2 |
70.0 |
2005-2018 |
|
Payerne (SW) |
46.8150 |
6.9440 |
0.7 |
72.4 |
2005-2020 |
|
Sede Boqer (IS) |
30.8597 |
34.7797 |
10.2 |
74.0 |
2005-2012 |
|
Tamanrasset (AL) |
22.7903 |
5.5292 |
1.4 |
98.0 |
2005-2020 |
|
Toravere (ES) |
58.2540 |
26.4620 |
-1.7 |
58.6 |
2005-2020 |
* The station of Izaña is often above the cloud cover seen in the satellite image, as noted in Urraca R. et al, 2018, so the satellite-based irradiance highly underestimates the available solar resources.
3. Calculation of solar radiation on inclined planes
The satellite based calculation described above produces values of global and beam irradiance on a horizontal plane, both broadband and spectrally resolved irradiance values.
However, modules and PV systems are generally installed at an inclined angle with regard to the horizontal plane or on tracking systems, so as to maximize the received in-plane irradiance. Therefore, the satellite retrieved irradiance values are not representative of the solar radiation available at the module surface, and it becomes necessary to estimate the in-plane irradiance.
There are several models in the scientific bibliography which use as input data the irradiance values on the horizontal plane of global and diffuse and/or beam irradiance components, to estimate the values of the beam and diffuse components on tilted surfaces. The sum of those is the in-plane global irradiance on a tilted surface. The beam irradiance comes directly from the solar disc, so the value on a tilted surface can be easily calculated from the value on the horizontal plane just knowing the sun position in the sky and the inclination and orientation of the inclined surface. On the contrary, the estimation of the diffuse component over tilted surfaces is not so straightforward, as it has been scattered by the atmosphere's components and as a result can be described as coming from the whole sky dome.
The way the diffuse component is defined is the main difference between the various estimation models. A comparison of some of these models can be found in Gracia Amillo and Huld, 2013. Models can be divided in two main categories, isotropic and anisotropic. The first group considers the diffuse irradiance to be uniformly distributed (isotropic) over the sky dome, similarly to what is observed under overcast situations. Under this assumption, the diffuse irradiance on a tilted surface is the value on the horizontal plane scaled by a factor that depends only on the inclination of the surface and accounts for the portion of the sky dome that is visible from the plane's surface.
However, the diffuse irradiance is hardly ever isotropic. Changing cloud cover but even in cloudless situations, it is easy to distinguish regions with different brightness. Besides the isotropic background, a bright area around the sun is easily noticeable. And depending on the cloud cover there may be bright regions around the zenith or the horizon. How these regions are estimated and considered vary between the anisotropic models. They can be classified in two groups, depending on how many regions are used beside the isotropic background. Whether they consider the circumsolar and/or horizon band.
The estimation model implemented in PVGIS is the one developed by Muneer T. (1990) which can be classified as anisotropic of two components. It performs similarly as other more complex models like the anisotropic models of three components like those developed by Perez or Reindl. In fact, the Muneer model proved the best performance in the study carried out by ESRA (2000). It distinguishes between clear and overcast sky conditions and sunlit and shaded surfaces.
4. Influence of shadows from terrain
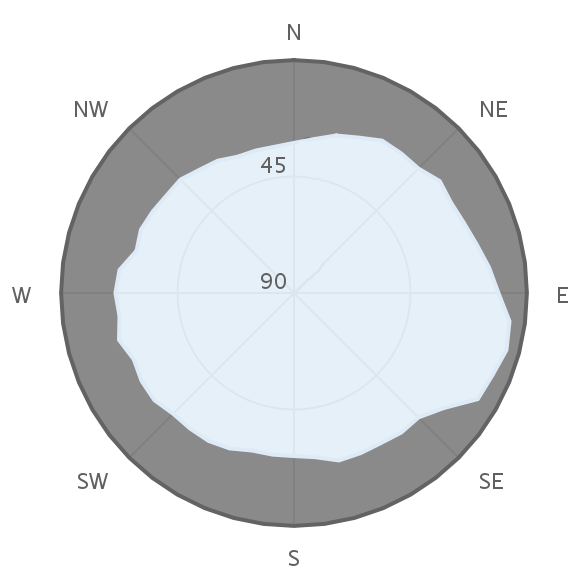
If you are near to hills or mountains there may be times when the sun is behind the hills and the solar radiation will be reduced to that coming from the sky or clouds. PVGIS uses information about the elevation of the terrain with a resolution of 3 arc-seconds (about 90m). This means that for every 90m we have a value for the ground elevation. From these data we have calculated the height of the horizon around each geographical location. These data are then used to calculate the times when the sun is shadowed by hills or mountains. When this happens the solar radiation is then calculated using only the diffuse part of the radiation. The calculations done within PVGIS can all make use of this information.
An example of the horizon height around a geographical point is shown in the next figure for a location in the Italian Alps (Macugnaga). The horizon is high except towards the east which is the direction down-valley from that place.
With a resolution of ~90m the calculations in PVGIS cannot take into account the effects of shadows from nearby objects such as houses or trees. However, PVGIS has the option to let the user upload a data file with the horizon height to use instead of the built-in horizon information.
5. Calculation of PV power output
The most important factor for the energy output of a PV system is of course the amount of solar radiation that arrives at the PV modules. But there are other factors that are important too. This chapter explains about the different effects that influence PV output and how they are calculated in PVGIS.
5.1 Nominal power of PV modules
When the power of a PV module is measured in the laboratory or at the factory, this is done under standardized conditions, known as the Standard Test Conditions (STC). The power measured at STC is called the nominal power or peak power (P_STC). These standard conditions are determined by the international standard IEC-60904-1 as:
- The light intensity (irradiance) should be 1000W/m² on the whole surface of the module. This value is about
- what you have at noon on a sunny day when the module is facing towards the sun, though under real conditions the irradiance may sometimes be even higher.
- The module temperature should be 25°C.
- The spectrum of the light should be equal to the global spectrum given in IEC 60904-3. This spectrum corresponds to the spectrum you find on a sunny day with the sun about 40° above the horizon and with the module inclined about 40° from horizontal facing the sun.
Bifacial modules are being increasingly used and under appropriate installation conditions can take advantage of the reflected light (albedo) on the rear surface of a module. PVGIS doesn't make dedicated calculations for bifacial modules at present. For users who wish to explore the possible benefits of this technology, one option is to input the power value for the bifacial nameplate irradiance (BNPI), which corresponds to 1000 W/m2 on the module front and 135 W/m2 on the module rear, applied in any method allowed by IEC TS 60904-1-2. P_BNPI can also be estimated using the P_STC value (front side) and the bifaciality factor, φ, as: P_BNPI = P_STC * (1 + φ * 0.135)
There are two caveats:
a) The power at BNPI refers to an open rack mounting condition, with an albedo of 0.2 e.g. for light sandy soil, a inclination of 37 degrees and a ground clearance of 1m. Device temperature and spectrum are as for STC (see Monokroussos et al for details). This BNPI approach is therefore not appropriate for building applied or building integrated installations, for which the light reaching the rear side is partially or fully obstructed.
b) It is also not appropriate for bifacial modules mounted on a north-south axis i.e. with side facing due east and due west. In such cases the yield may estimated by running two PVGIS calculations with P_STC (one for east and one for west facing orientation), applying the bifaciality factor to the yield for the rear side and then summing the two results.
5.2 Estimating the real power output of PV modules
When the PV modules are mounted outdoors, the conditions can be very different from these standard conditions and therefore also the power output will be very different. PVGIS makes corrections for a number of different effects that influence PV power.
5.2.1 Shallow-angle reflection
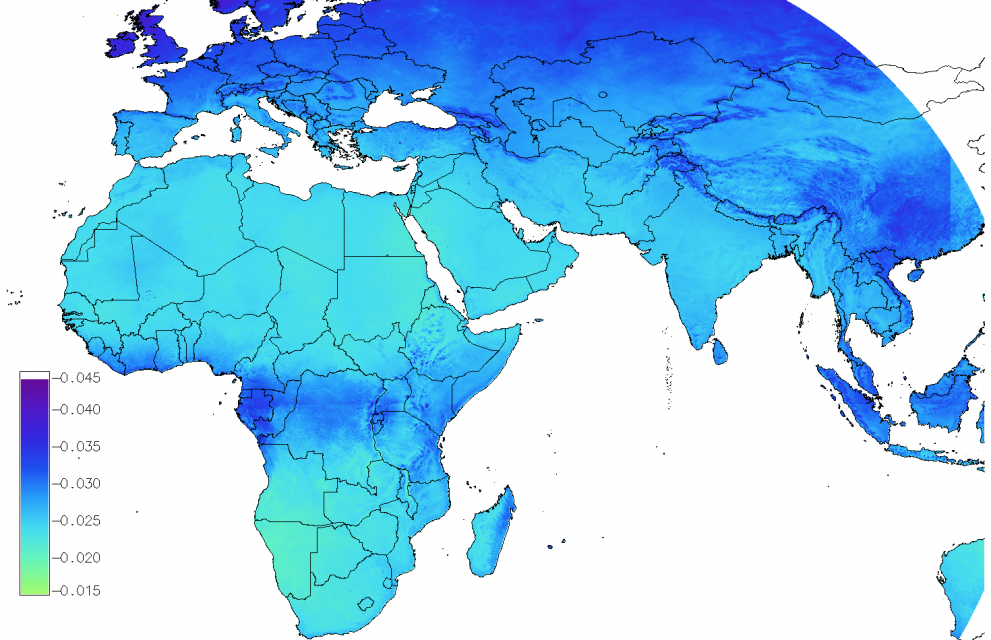
When light hits the PV module surface some of it will be reflected away without entering the module. For most module types the amount of light reflected away will increase if the light falls on the module at a sharp angle, and when the light is close to parallel to the module surface nearly all the light will be reflected away. This is calculated using a mathematical model described in (Martin&Ruiz, 2001, Martin&Ruiz, 2013). Generally, this effect causes a loss of 2-4% of the sunlight, though this will be lower for sun-tracking PV systems (Huld et al., 2015). Figure 3 shows a map of this effect. The calculation for this map used a module inclination of 20 degrees facing the equator.
5.2.2 Effect of changes in the solar spectrum
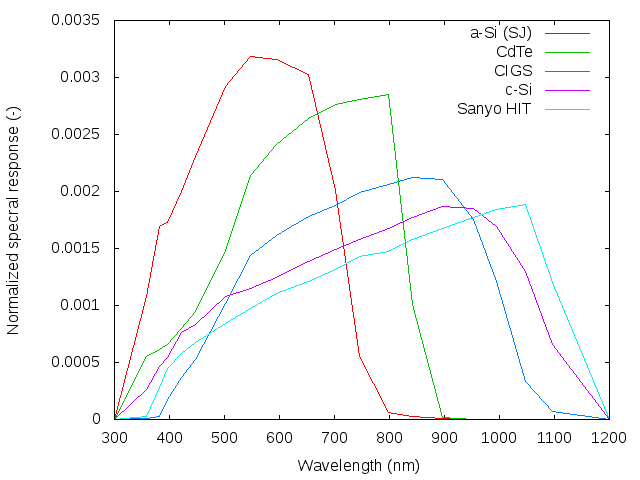
PV modules are sensitive to light only within a certain range of wavelengths. The range depends on the type of module. The curve of sensitivity is known as the spectral response. The next figure shows the spectral response curves for a number of PV technologies. Some PV technologies are sensitive to both visible and near-infrared radiation (for instance crystalline silicon) while others are more restricted towards the visible part of the spectrum (such as amorphous silicon). The measurements were performed at the European Solar Test Installation (ESTI) of the Joint Research Centre.
The spectrum of sunlight changes with time of day and with the meterological conditions. It is well known that sunlight is more red near sunrise and sunset. It is perhaps less well known that light coming from the clouds has a higher content of blue light and decreased red light. All this means that the PV power will depend on the spectrum of the sunlight.
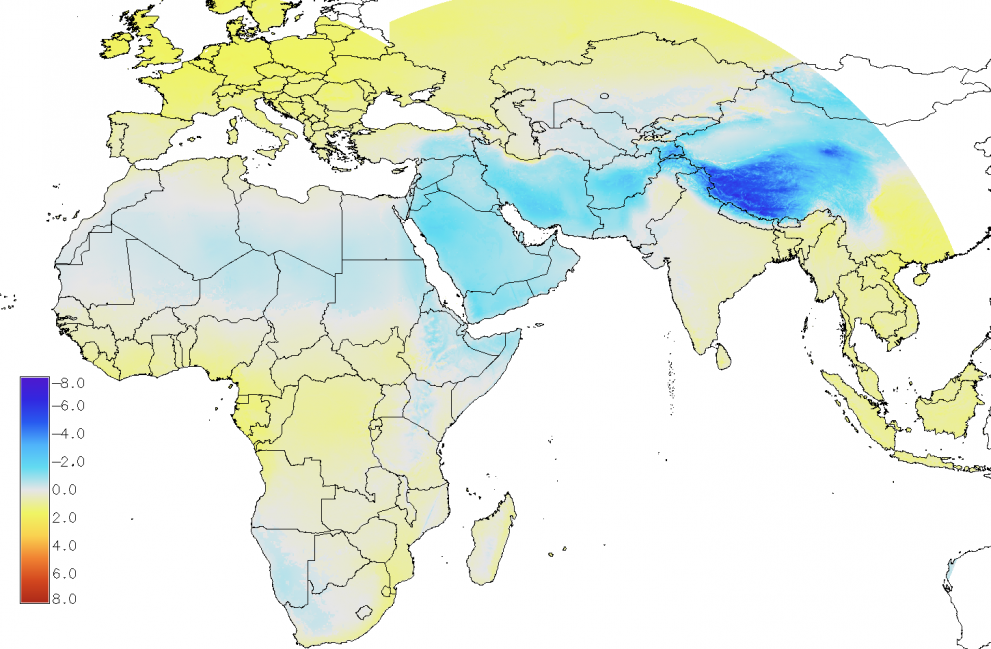
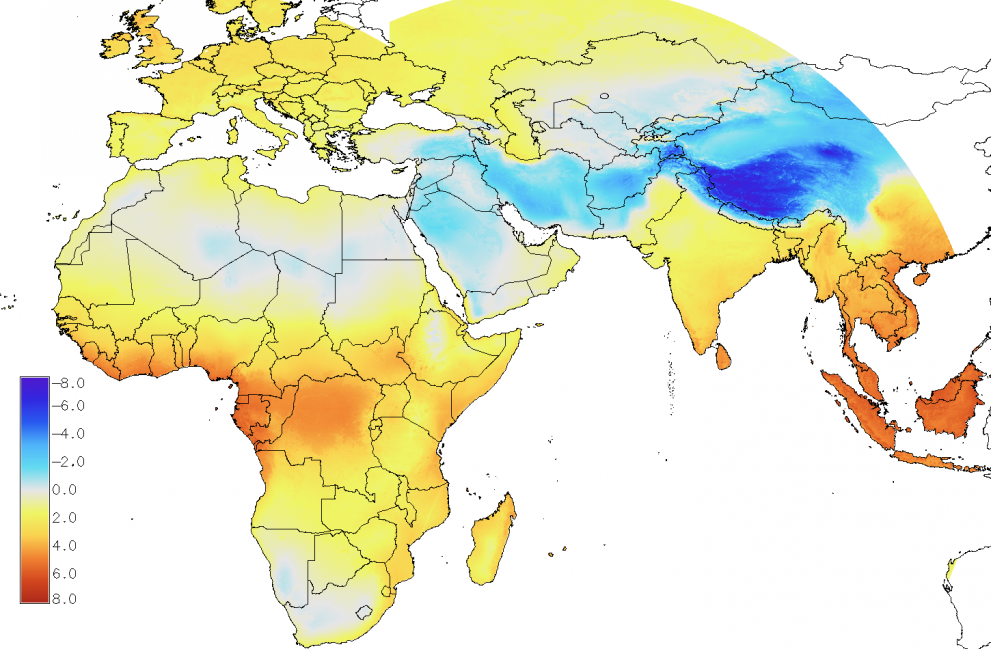
We have used solar radiation data from satellite that have been calculated for different spectral bands (Mueller et al., 2012) to calculate the effect of spectrum changes on the PV energy output. Maps of the calculations results can be found in Gracia et al, 2014 and Huld & Gracia Amillo, 2015. The spectral effects have been calculated for crystalline silicon and for Cadmium Telluride modules. These results are included in the PVGIS calculations for these two module types. The next figures show the effect of spectral variations on energy output for two PV technologies. The maps show the percentage increase (or decrease) in the energy output due to spectral effects, i.e. value of -3 means the spectral effects cause a decrease in the energy output of 3%.
5.2.3 PV power dependence on irradiance and module temperature
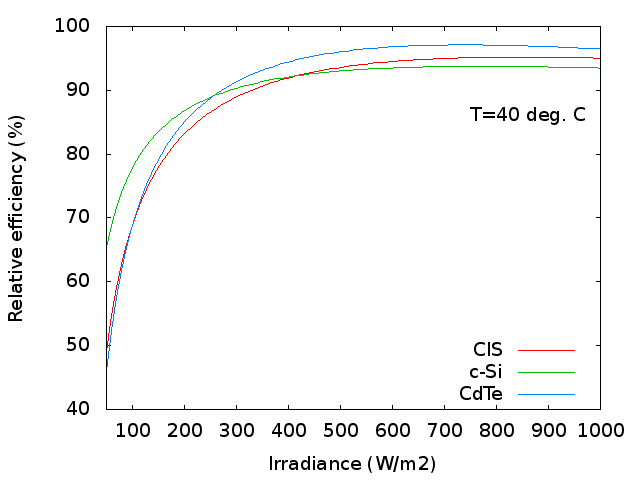
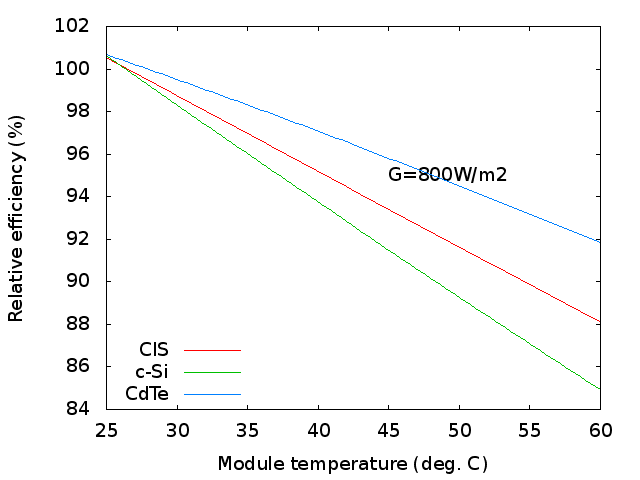
The efficiency of PV modules depends on the temperature of the module and on the solar irradiance. Generally, the efficiency decreases with increasing temperature, and the strength of this effect depends on the PV technology. For most module types, the efficiency is nearly constant for irradiances from about 400W/m2 to at least 1000W/m2 (for constant module temperature), but at lower irradiance the efficiency tends to decrease. Since the standard test conditions measure module power at high irradiance (1000W/m2) and fairly low temperature (25°C) the overall result is that for most places the average module efficiency is a bit lower than the efficiency measured at the factory.
The next figure shows the effects of temperature and irradiance for a number of PV module types. The curves show the relative efficiency, that is, the module efficiency as a percentage of the efficiency measured at STC. The first one, shows the relative efficiency at constant temperature T=40°C at different irradiance levels; while the second shows the relative efficiency at constant irradiance at different module temperatures. The measurements were performed at the European Solar Test Installation (ESTI) of the Joint Research Centre.
PVGIS calculates the effects of irradiance and module temperature using a model described in (Huld et al., 2011), The power is assumed to depend on irradiance G and module temperature Tm in the following way:
[1] P = G/1000 * A*eff(G,Tm) = G/1000*A*effnom * effrel(G,Tm)
[2] effrel(G',T'm)=1+k1ln(G')+k2ln(G')2 +k3T'm +k4T'mln(G') +k5T'mln(G')2 +k6T'm2
where G'=G/1000 and T'm=Tm-25.
The coefficients k1 to k6 are found for each PV technology by fitting to measured data. The coefficients used in PVGIS are based on measurements performed at ESTI and are given in the next table.
| Coefficient | c-Si | CIS | CdTe |
|---|---|---|---|
| k1 | -0.017237 | -0.005554 | -0.046689 |
| k2 | -0.040465 | -0.038724 | -0.072844 |
| k3 | -0.004702 | -0.003723 | -0.002262 |
| k4 | 0.000149 | -0.000905 | 0.000276 |
| k5 | 0.000170 | -0.001256 | 0.000159 |
| k6 | 0.000005 | 0.000001 | -0.000006 |
5.2.4 Module temperature
When the sun shines on the PV modules the temperature of the modules will rise above the local air temperature. This means that the module temperature depends on both air temperature and the irradiance (strictly speaking the irradiance corrected for reflectivity since light that is reflected away will not heat the module). In addition, if there is wind it may help to cool the modules.
These effects are treated in PVGIS using a model suggested by Faiman (Faiman, 2008). The module temperature Tm can be calculated as:
[3] Tm = Ta + G/(U0+U1W)
Here, Ta is the air temperature and W is the wind speed. The table below shows the coefficients U0 and U1 used in PVGIS. The values for free standing modules are based on those reported by Koehl et al, 2011.
|
Module technology |
Installation |
uo W/(˚C.m2) |
u1 W.s/(˚C.m3) |
|
c-Si |
Free-standing |
26.9 |
6.2 |
|
|
BIPV/BAPV |
20.0 |
3.2 |
|
CI(G)S |
Free-standing |
22.64 |
3.6 |
|
|
BIPV/BAPV |
20.0 |
2.0 |
|
CdTe |
Free-standing |
23.37 |
5.44 |
|
|
BIPV/BAPV |
20.0 |
3.2 |
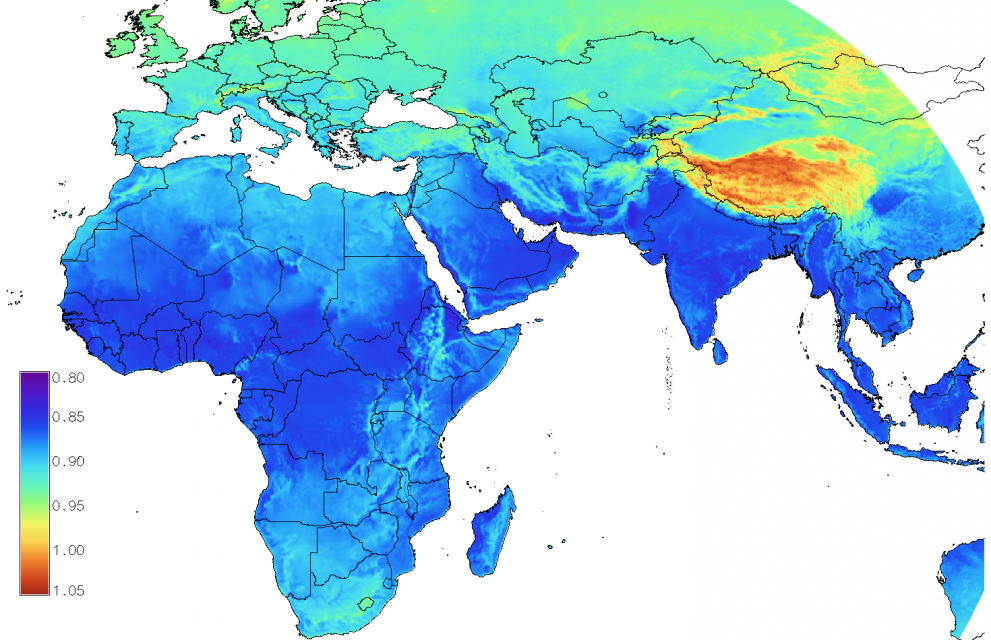
The overall change in PV output due to all the effects described above are shown in the next figure and can also be found in Huld &Gracia Amillo, 2015.
5.2.5 System losses and degradation with age
All the calculations described above will in the end give the PV power that can be delivered at the connectors of the module (or array). But before the power arrives at the grid it must be transformed into AC current by the inverter, which causes another loss. There are also losses in cables and because the modules are not all exactly the same power. At the moment we do not have enough information to calculate all these effects, so the loss can be input by the user.
In addition the power of PV modules tends to decrease slowly with age. A large study (Jordan and Kurtz, 2013) found that PV modules typically lose about 0.5% of power per year of operation. With an expected system lifetime of 20 years this would mean that the power at the end of the 20 year period the power would be down to 90% of the original power and on average over 20 years the power would be 95% of the original power.
Considering the system losses and the losses due to ageing we recommend a value of 14% for the "system loss" that the user gives as input to PVGIS.
5.2.6 Other effects not considered in PVGIS
There are a number of other effects that can influence the energy output of PV systems. These effects are not included in the PVGIS calculations. Among these are:
- Snow. If the PV modules are covered (even partially) by snow the energy output is typically very low. This effect depends on how often it snows but even more importantly on how long the snow stays on the modules before melting or sliding off. This in turn depends on the temperature but also on the module inclination and how the modules are installed.
- Dust and dirt. In areas with a lot of dust in the air the modules will tend to be covered in dust. How long the dust stays on the modules depends on rainfall and on the inclination of the modules. The effect will of course be different if the modules are cleaned from time to time.
- Partial shadowing. If only a part of a PV module is in shadow it may reduce the energy output strongly. This effect is very local and depends on the exact way the modules are installed. At the moment we have no way of taking this into account, but it should of course be considered when installing the PV system.
6. Calculation of PV electricity cost
PVGIS can calculate the cost of electricity produced by a grid-connected PV system. The calculation takes into account the cost of buying and installing the PV system, the cost of maintenance, and the cost of financing. All these costs are then compared with the estimated PV energy production during the expected lifetime of the system.
The calculation of PV electricity cost is done using a "Levelized Cost Of Energy" (LCOE) method. In this calculation an initial loan is used to pay the whole cost of the PV system and is repaid in fixed yearly installments until the end of the lifetime of the system. In addition to the repayment of the loan the calculation assumes that operation and maintenance of the system will be 2% of the original cost of the system every year of the life of the system.
The calculation is described in more detail in the report by (Huld et al., 2014). See als the Huld et al (2016) reference below for further background.
7. Calculation of off-grid PV system performance
It is more complicated to calculate the performance of off-grid PV systems than to estimate the energy production by grid-connected PV systems. Grid-connected systems can send any power not consumed locally to the grid, which then acts as an infinitely large battery. For off-grid PV systems the energy produced by the PV system cannot be transported away and must either be consumed or stored, typically in batteries. This makes it more difficult to estimate the PV energy production, because it depends on the energy consumption, and it will depend on when the energy is consumed. If there is too much energy left over when the consumption needs have been met, the battery will become full and the PV power will have to drop. If the PV production is too low the battery may become empty and not enough energy will be delivered.
PVGIS calculates the off-grid PV energy production taking into account the solar radiation for every hour over a period of several years. The calculation is done in the following steps:
- For every hour calculate the solar radiation on the PV module(s) and the PV power
- If the PV power is greater than the energy consumption, store the rest of the energy in the battery.
- If the PV power is less than the energy consumption, get the missing energy from the battery.
- If the battery becomes full, calculate the energy "wasted" because the PV power could be neither consumed nor stored.
- If the battery becomes empty, calculate the missing energy and add the day to the count of days where the system ran out of energy.
The energy consumption varies during the day but the pattern of consumption is assumed to repeat in the same way every day. PVGIS uses by default a particular energy consumption pattern where most of the energy is consumed after sunset, but the user may upload a different hourly consumption pattern.
See also the PVGIS User Manual (section 6, "calculation outputs for the off-grid PV calculations") for more info.
References
- Faiman, D. Assessing the outdoor operating temperature of photovoltaic modules. Prog. Photovolt. Res. Appl. 2008, 16, 307–315
- Gracia Amillo, A.M.; Huld, T. Performance comparison of different models for the estimation of global irradiance on inclined surfaces. Validation of the model implemented in PVGIS. JRC Technical Report EUR 26075 EN, JRC81902, ISBN 978-92-79-32507-6, ISSN 1831-9424, doi:10.2790/91554 2013.
- Gracia Amillo, A.M; Huld, T.; Müller, R. A new database of global and direct solar radiation using the eastern meteosat satellite, models and validation. Remote Sens. 2014, 6, 8165–8189.
- Gracia Amillo, A.M.; Taylor, N; Martinez A.M.; Dunlop E.D.; Mavrogiorgios P.; Fahl F.; Arcaro G.; Pinedo I. Adapting PVGIS to Trends in Climate, Technology and User Needs. 38th European Photovoltaic Solar Energy Conference and Exhibition (PVSEC), 2021, 907 - 911.
- Habte A., Sengupta M. and Lopez A. Evaluation of the National Solar Radiation Database (NSRDB): 1998–2015. National Renewable Energy Laboratory Technical Report NREL/TP-5D00-67722. 2017
- Huld T. and Gracia Amillo A. M. Estimating PV Module Performance over Large Geographical Regions: The Role of Irradiance, Air Temperature, Wind Speed and Solar Spectrum. Energies. 2015 8, 5159-5181.
- Huld T., Friesen G., Skoczek A., Kenny R.P., Sample T., Field M., Dunlop E.D. A power-rating model for crystalline silicon PV modules Solar Energy Materials & Solar Cells. 2011 95, 3359-3369.
- Huld, T.; Müller, R., Gambardella A. A new solar radiation database for estimating PV performance in Europe and Africa Solar Energy 2012, 86, 1803-1815.
- Huld T., Jäger-Waldau A., Ossenbrink H., Szábo S., Dunlop E. and Taylor N. Cost Maps for Unsubsidised Photovoltaic Electricity. JRC Report JRC 91937 2014
- Huld, T., Moner-Girona, M., and Kriston, A. (2017). Geospatial Analysis of Photovoltaic Mini-Grid System Performance. Energies 10, 218
- Bollmeyer, C., Keller, J.D., Ohlwein, C., Wahl, S., Crewell, S., Friederichs, P., Hense, A., Keune, J., Kneifel, S., Pscheidt, I., Redl, S. , Steinke, S.: Towards a high-resolution regional reanalysis for the European CORDEX system Quarterly Journal of the Royal Meteorological Society 2015, 141, 1-15
- Jordan D.C. and Kurtz S. R. Photovoltaic Degradation Rates—an Analytical Review Prog. Photovolt. Res. Appl.2013, 21, 12-29
- Koehl, M., Heck, M., Wiesmeier, S., Wirth, J. Modeling of the nominal operating cell temperature based on outdoor weathering. Solar Energy Mater. Solar Cells 2011, 95, 1638–1646.
- Martin N. and Ruiz J. M. Calculation of the PV modules angular losses under field conditions by means of an analytical model. Solar Energy Materials & Solar Cells. 2001, 70, 25-38
- Martin N. and Ruiz J. M. Corrigendum to "Calculation of the PV modules angular losses under field conditions by means of an analytical model." Solar Energy Materials & Solar Cells. 2013, 110, p. 154
- Monokroussos C., Gao Q., Zhang X., Lee E., Wang Y., Zou C., Rimmelspacher L., Castro J.B., Schweiger M., Herrmann W., Rear-side spectral irradiance at 1 sun and application to bifacial module power rating (2020) Progress in Photovoltaics: Research and Applications, 28 (8), pp. 755 - 766, DOI: 10.1002/pip.3268
- Müller, R.; Behrendt, T.; Hammer, A.; Kemper, A. A new algorithm for the satellite-based retrieval of solar surface irradiance in spectral bands. Remote Sens. 2012, 4, 622–647.
- Müller, R.; Matsoukas, C.; Gratzki, A.; Behr, H.; Hollmann, R. The CM-SAF operational scheme for the satellite based retrieval of solar surface irradiance—A LUT based eigenvector hybrid approach. Remote Sens. Environ. 2009, 113, 1012–1024.
- Muneer, T., Solar radiation model for Europe. Building Services Engineering Research and Technology 1990, 11(4), 153-163.
