Before the start of the coronavirus pandemic, more than half of EU citizens considered their lives to be fair, according to a new report from the JRC.
As the Commission proposes a major plan to put the EU firmly on a sustainable, inclusive, even and fair recovery path, this report offers a snapshot of the state of fairness in Europe before the coronavirus outbreak.
It also provides a benchmark against which some of the consequences of the current crisis can be evaluated.
The snapshot shows how there are regional differences in perceptions of fairness, with Northern Europeans more likely to perceive their lives as fair than those in Eastern and Southern Europe.
Perceptions of fairness also differ markedly across socio-demographic groups, with comparatively low levels of fairness perception among unemployed individuals and those with low incomes.
In order to understand how these perceptions are shaped, the report explores various measures of inequality. Too large inequalities in income, education or health can make people feel that life is not fair.
While EU-wide income inequality has slightly declined since the last major crisis in 2008, it has increased in Southern Europe. Educational attainment still strongly depends on family circumstances. And there is evidence that social protection and taxation systems are increasingly challenged by the digitalisation of the economy and the changing work relations.
As Europe begins to emerge from this crisis, fairness and perceptions of fairness are important. They can have a real impact on happiness and how people engage with others in society. It is also clear that the health and economic effects of the Covid-19 pandemic are being borne disproportionally by those who are less well off.
The JRC will continue to support a fair recovery path with evidence on how the pandemic is shaping inequalities and perceptions of fairness across Europe.
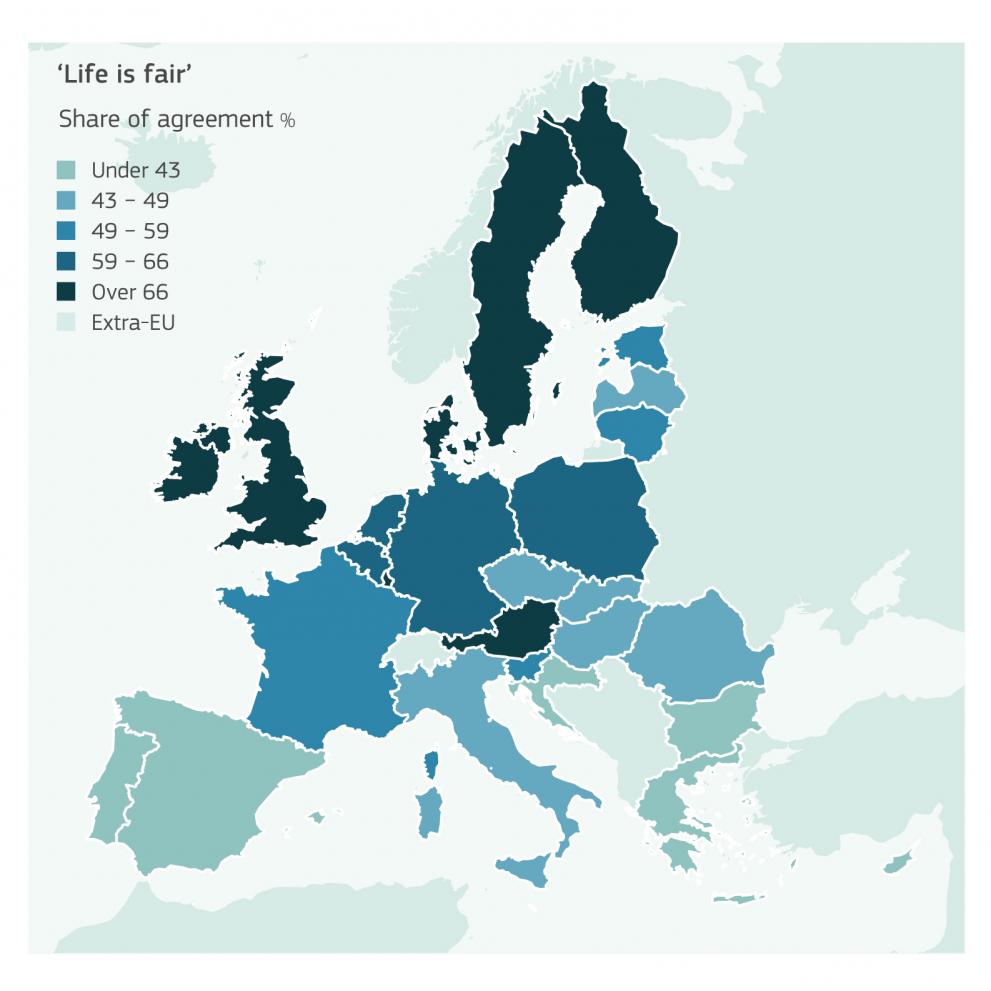
While most Northern Europeans perceive their life as fair, Eastern and Southern Europeans tend to have more negative fairness perceptions
JRC experts analysed the results of a Eurobarometer survey to understand perceptions of fairness across Europe. On average, about half of European adults either strongly agree (11%) or agree (43 %) with the statement that their lives are fair. A sizable share of the respondents (about 22 %) either disagree or strongly disagree.
Average perceptions of fairness differ widely across EU countries. Overall, Northern and Western EU countries show higher levels of fairness perceptions while levels in Southern and Eastern European countries are lower.
Country specific figures show that only 26% of Greeks, 36% of Croatians and 39 % of Bulgarians and Cypriots believe that their life is fair. Particularly positive fairness perceptions are observed in Ireland (79%), Denmark (78%) and Finland (76%).

Map showing the share of people in a country that agree with the statement ‘most of the things that happen in my life are fair’. The darker is the colour, the larger is the share of the population agreeing that their life is fair. Source: JRC fairness report (2020).
A slight decline in EU-wide income inequality masks increases in Southern Europe
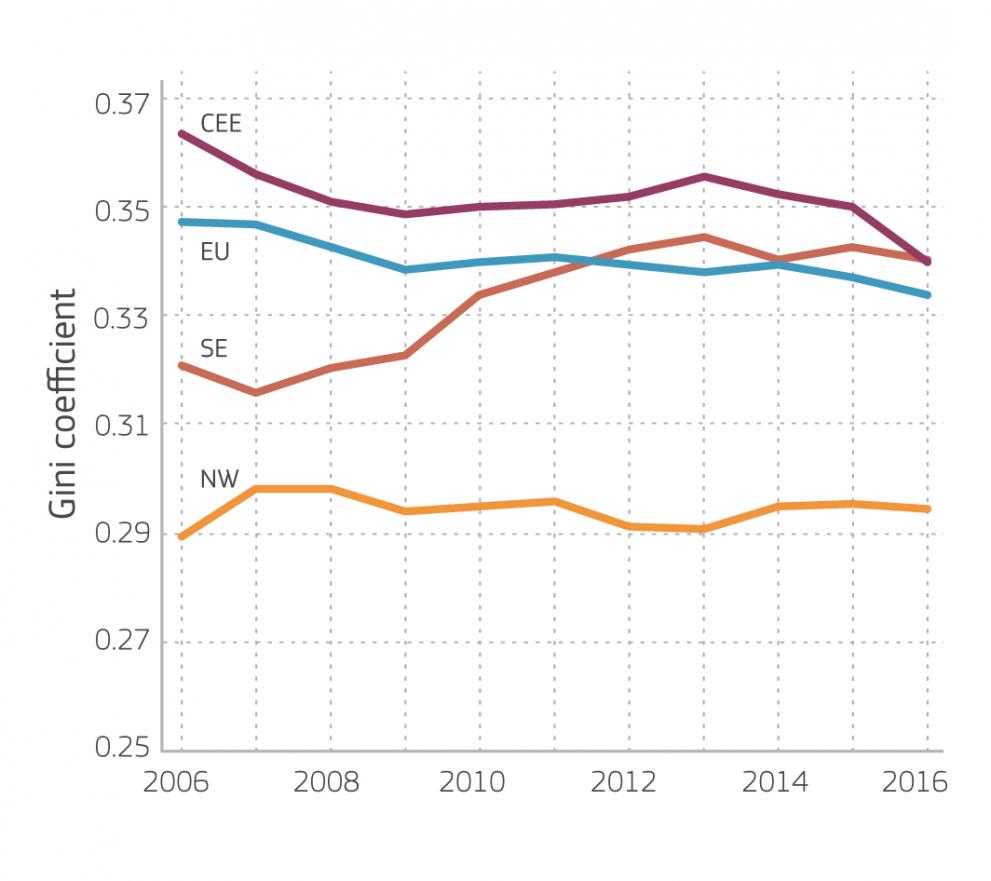
The report shows that over the period 2006-2016, income inequality was highest in the EU’s poorest geographical area, Central and Eastern Europe. It was lowest in the richest geographical area, the North-West.
While there was a slightly declining trend in EU-wide inequality over this period, the picture is more mixed when looking into different geographical areas. Income inequality increased in Southern Europe between 2007 and 2013.
In Central and Eastern Europe it decreased. No clear trend is observed for the North-West. Nearly constant EU-wide income inequality hides increases in the level of inequality in Southern Europe.

The graph shows the evolution of inequality in net household income in the EU and by macro-region, 2006-2016. The ‘Gini coefficient’ is a standard measure of income inequality. The coefficient ranges from 0-1. A country in which every resident has the same income would have a coefficient of 0. A country in which one resident earned all the income while everyone else earned nothing, would have an coefficient of 1. Source: JRC fairness report (2020).
Educational attainment in Europe still strongly depends on family circumstances
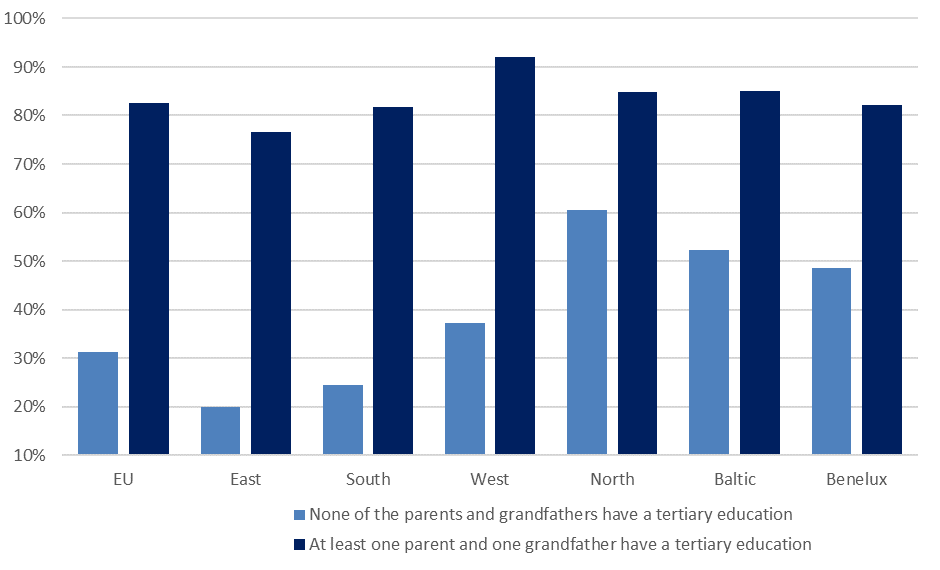
In the EU, about 83% of individuals who have at least one parent and one grandfather with a tertiary (university-level) education go on to complete tertiary education themselves.
Only 31% of those with less highly educated parents and grandfathers do the same. In other words, the chances of having a tertiary education are 2.7 times higher for the first group than for the second one. This gap is more pronounced in Southern and Eastern Europe than in Northern Europe.

The graph depicts tertiary education across generations. The bars show the share of individuals reaching tertiary education attainment by parents’ and grandfather’s educational attainment. Source: JRC calculations based on the Eurobarometer on fairness.
Digitalisation and changing work relations require appropriate social protection and taxation systems
‘Atypical’ forms of work (including part-time, temporary, fixed-term, casual and seasonal work, self-employment, independent work and homework) have become more common in a digitalised economy. The report highlights that atypical workers are often only partially covered by social security systems.

The graphs displays the differences across EU countries in unemployment insurance coverage for standard and non-standard workers and the self-employed. The ‘potential coverage rate’ is the percentage of workers who would be covered by unemployment insurance schemes if they became unemployed. Source: JRC fairness report (2020).
The report also finds a mismatch between the location of economic activity and the place of taxation, which facilitates tax avoidance.
Background
The coronavirus has shaken Europe and the world to its core, testing healthcare and welfare systems, our societies and economies and our way of living and working together. To protect lives and livelihoods, repair the Single Market, as well as to build a lasting and prosperous recovery, the European Commission is proposing to harness the full potential of the EU budget.
At its heart the recovery will be sustainable, even, inclusive and fair.
The JRC report 'Beyond averages – Fairness in an economy that works for people', was written before the outbreak of the coronavirus pandemic. It addresses some of the most pertinent fairness dimensions for a fair, inclusive and social European Union.
Income inequality, educational inequality and incomplete coverage of social security systems are discussed from a pre-crisis perspective. The report offers a snapshot of the state of fairness in Europe before the Covid-19 outbreak and a benchmark against which some of the consequences of the current crisis can be evaluated.
Developments and determinants of fairness, inclusive growth and solidarity in the EU will also be examined in the upcoming Employment and Social Developments in Europe 2020 annual review.
Related Content
JRC report: Beyond averages - Fairness in an economy that works for people
Details
- Publication date
- 12 June 2020
