Global anthropogenic fossil CO2 emissions increased by 1.2% in 2017 compared to the previous year, reaching 37.1 gigatonnes (Gt) CO2.
The 0.43 GT increase corresponds to the total yearly CO2 emissions of Poland and Czech Republic put together.
In the EU, strong economic performance resulted in a slight increase of CO2 emissions (1.1%).
This increase (38 megatonnes (Mt)) corresponds approximately to the total CO2 emissions of Slovakia in 2017 (37.855 Mt CO2/year).
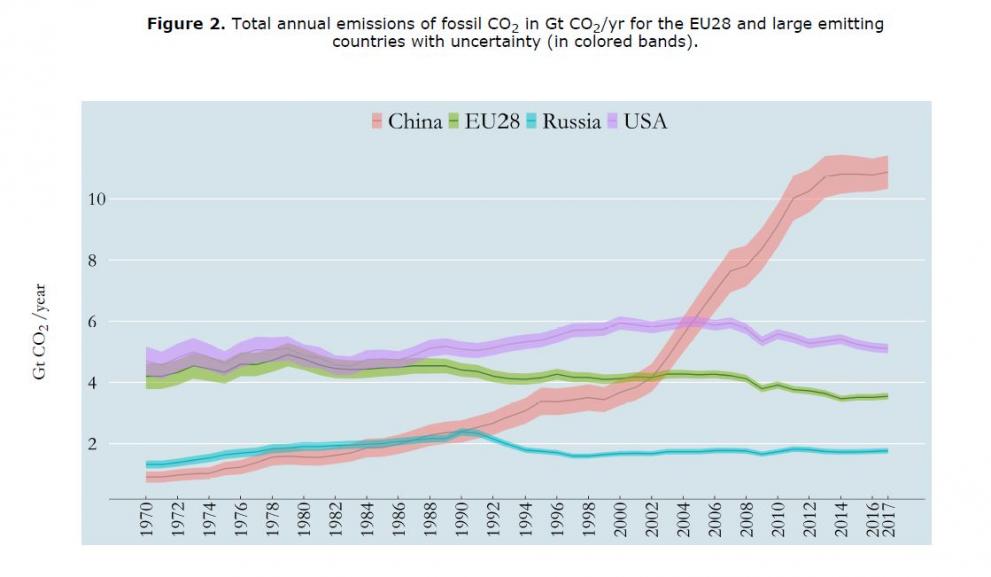
In 2017, the EU's CO2 emissions were 19.5% lower than in 1990, and 16.5% (or 3.5 GT) lower than in 2005. There have been strong reductions in the industry, power and buildings sectors, but an increase in the transport sector.
Per capita emissions in the EU are now below those of China and half of those in the US.
The CO2 intensity of the EU economy is around a third below the US and around two thirds below China.
In 2017, emissions in China increased by 0.9%. The 100 Mt increase corresponds approximately to the total CO2 emissions of Belgium in 2017 (104.221 Mt CO2/year).
China's emission growth has been very strong since 2000, although they have stabilised since 2014. In 2017, China's total CO2 emissions amounted to 10.9 GT.
In the US, emissions have been stable since 1990, but fell by 0.8% from 2016 to 2017, amounting to a total of 5.1 GT.
This was mainly due to a 2.5% decrease in coal power and a 1.4% decrease in natural gas consumption.
And Russia's CO2 emissions increased by 1.1% to a total of about 1.8 Gt in 2017.

Globally, CO2 emissions of a number of countries with more than 1% share in total global CO2 emissions are showing decreases of:
- 0.1% in Australia,
- 0.3% in Germany,
- 2.8% in Mexico and 1.9% in South Africa.
And increases of:
- 0.2% in Brazil,
- 2.7% in Canada,
- 4.7% in Indonesia,
- 5.7% in Iran,
- 3.5% in Korea,
- 1.5% in Saudi Arabia and
- 11% in Turkey.
Looking at the global emission profile, it is clear that continuous efforts are needed to reduce emissions.
On 28 November 2018, the European Commission stepped up its efforts by proposing a strategy for Europe to become the world's first major economy to become climate neutral by 2050.
The European Commission's Joint Research Centre (JRC) report provides the CO2 emissions trends for all countries across the globe from 1970 until 2017.
The continuous tracking of emissions by the JRC offers valuable information for policymakers, stakeholders and citizens on the causes of emission increases, and will continue to inform the debate in the future.
Emissions Database for Global Atmospheric Research
The Emissions Database for Global Atmospheric Research brings together estimates of the historic greenhouse gas emission profiles of all countries.
It does so in a transparent manner, with a common methodology across all countries.
Since 1970 the database has been a yardstick for the scientific community, which needs data to examine the drivers of emissions and solutions to address them.
Related Content
JRC Report: Fossil CO2 and GHG emissions of all world countries
Details
- Publication date
- 28 January 2019
