
The ultimate goal of this comprehensive hub is to offer data to help improve risk assessments in the stages before, during and after a disaster hits Europe.
As the main deliverable of the Science Pillar of the Union Civil Protection Knowledge Network for 2022, the RDH intends to support local and national authorities with their commitments related to the Sendai framework, with climate change adaptation strategies, and with national risk assessments reports.
A new, central role in the challenge of adapting to climate change
In the course of 2022, the Risk Data Hub will further become a central data source for Member States to support their climate adaptation actions.
Policymakers and technical experts need to understand what has been lost as a result of climate-related disasters and what they can do to avoid further losses. The RDH helps them get data for this, which will be crucial to achieve the objectives of risk reduction and climate change adaptation at regional and local scale.
Helping national authorities improve risk management decisions
The Risk Data Hub gives decision-makers access to robust statistics that can support evidence-informed policymaking. For instance, post-event records and pre-event assessments can significantly support the development of decision-making tools such as cost-benefit analysis.
Also, by identifying geographically located drivers of disasters (both natural and human-made), the RDH allows intertwining global policies with local scales of practice and implementation.
To reflect users’ different needs, the revamped platform encompasses different portals. For instance, there’s one providing risk analysis data, another one delivering long-term disaster loss data and a third one with disaster risk management data from other projects such as Horizon 2020.
National authorities can privately and securely access, store and manage disaster risk data according to the filters that suit them best. Soon they will also be able to create ad-hoc reports on specific areas, hazards and/or assets using RDH data at different levels of aggregation.
Would you like to learn how to make the most of the Risk Data Hub?
To help the experts, local and national authorities familiarise themselves with the new features and learn how to better exploit the available data, the JRC is organising a free workshop on 15 June.
Risk indicators, matrixes and trends
To visualise and to analyse RDH data, users can select – besides the desired combination of hazards and asset – from country to local administrative units, and from 2 to 25 years ahead, to estimate a risk and its components.
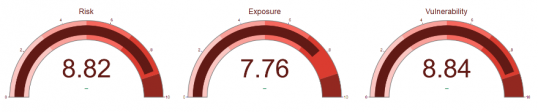
Resorting to data on hazards and assets the platform can compute different risk components: hazards footprints, assets exposure and, ultimately, a risk indicator. For example, the image below shows Italy’s risk regarding “residential buildings”, considering hazards like earthquakes, landslides, coastal floods and river floods and using a temporal aggregation of 2 years ahead.
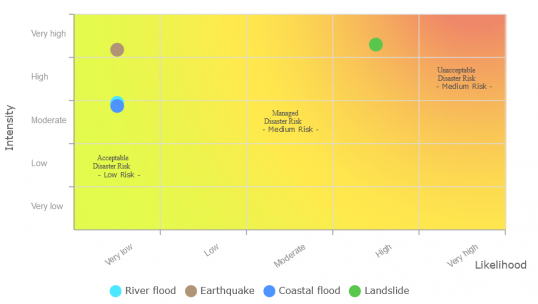
Another example of what the RDH can offer is the risk matrixes. The example below outlines the estimated intensity of anticipated events, and the likelihood of equaling or exceeding the given threshold of intensity, for residential buildings within a timeframe of 2 years in Tuscany, Italy.
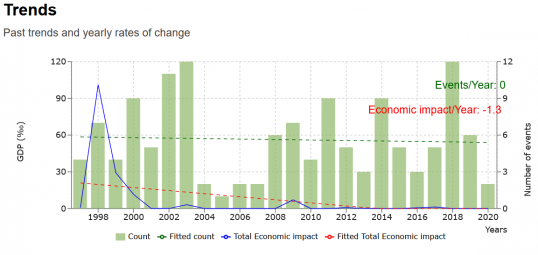
Thanks to the variety of input data sources (all referenced and downloadable from the platform), the RDH can also portray the geo-temporal dimensions of these patterns and display trends and yearly changes for both the number of events and total losses. In the figure below, they are measured as a share of GDP (in %).
Details
- Publication date
- 11 April 2022
- Author
- Joint Research Centre