The Commission’s Regional Competitiveness Index assess the ability of EU regions to offer an attractive and sustainable environment for residents and companies to live and work in the region. The purpose of the tool is to help regions to boost their competitiveness.
The Province of Utrecht in the Netherlands is the EU’s most competitive region according to the index. It is followed by another Dutch region, South Holland and Île-de-France, the region of Paris. Beyond the Netherlands and France, regions from Sweden, Denmark and Belgium made it into the first ten.
When it comes to changes in competitiveness, Lithuania’s capital region, Portugal’s North region and Poland’s Warsaw region improved their competitiveness the most since 2019.
Despite eastern and southern regions catching up, as also depicted by the map below, large differences across the EU remain in competitiveness.
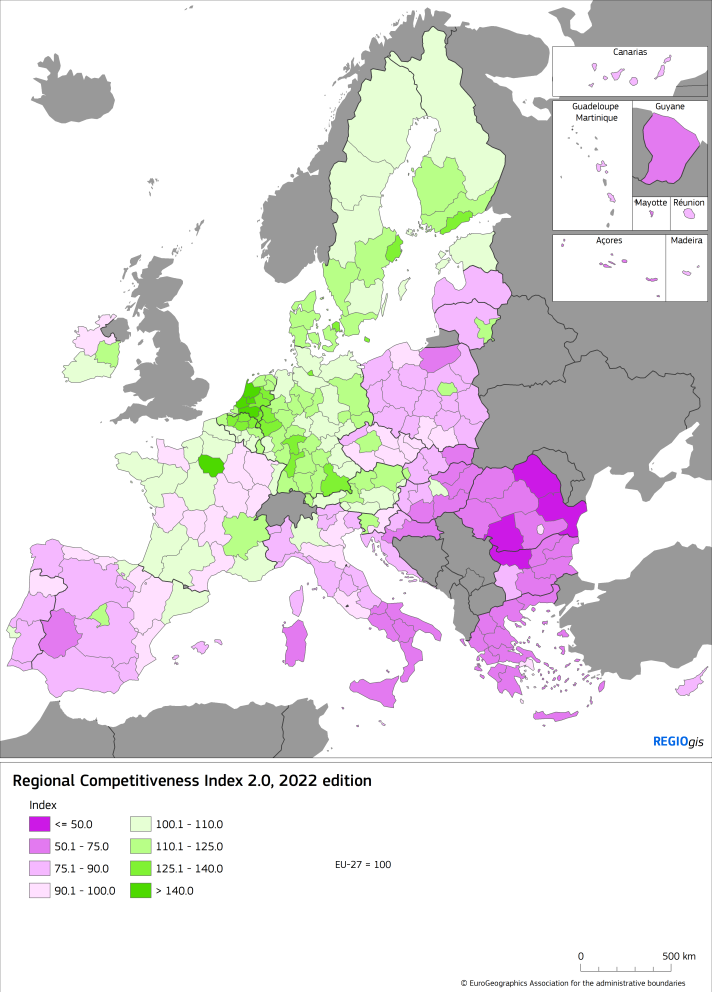
The regions scoring lowest on the index are located in Central and South European Member States. In these countries, only regions of capital cities or of other large cities score above the EU average. In comparison, all regions in Austria, the Benelux states, Germany and the Scandinavian EU countries score above the EU average.
Catch me if you can
Many southern and eastern regions of the EU are catching up in competitiveness. As the map on the left below shows, this is especially true if, we compare their current and 2016 result. In comparison with 2019 however, the patterns are more diverse.
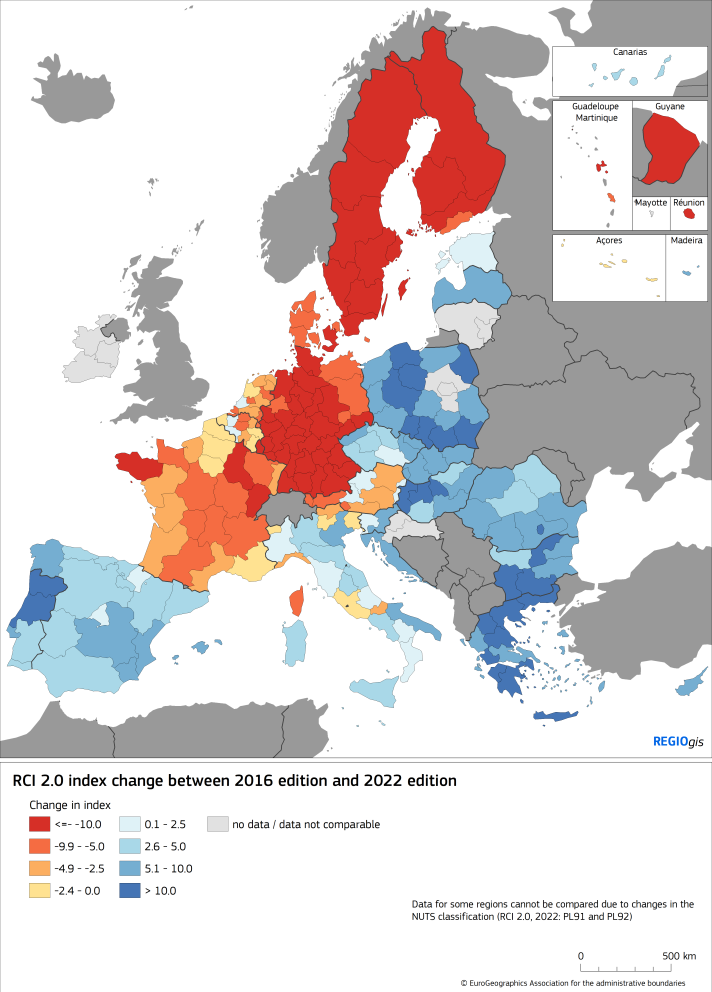
After 2019, the catching-up of regions in the Baltics, Croatia, Hungary, Poland and Slovenia continued, while regions in Czechia, Romania, Slovakia and part of Bulgaria lost momentum and their competitiveness weakened compared to the EU average.
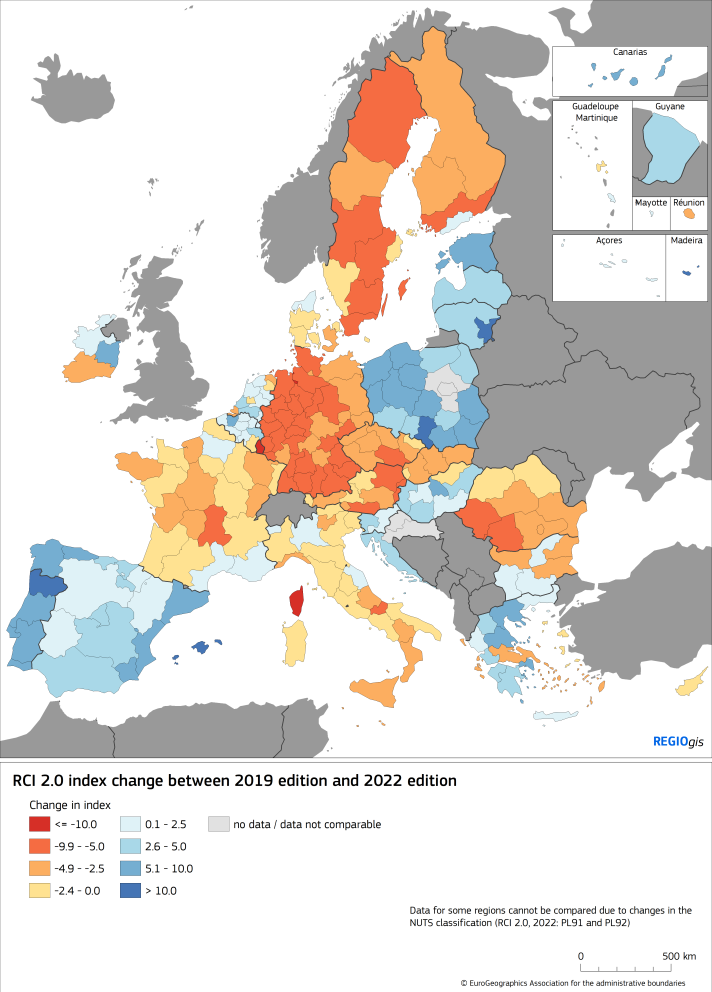
There is a similar divergence in South Europe, where regions in Greece, Portugal and Spain improved their performance since 2019, while most Italian regions performed less well.
Takes two to tango
A closer look at the relationship between regional competitiveness and female achievement shows that the more competitive the region, the higher the achievement of women.
The relation between two factors were examined based on the Female Achievement Index, which encompasses dimensions such as working conditions, knowledge, work-time balance, political representativeness, health, safety, security, trust, and life satisfaction.
Most regions with a below-average regional competitiveness index have a low level of female achievement, especially the less developed regions.
Background
The Commission launched the EU Regional Competitiveness Index in 2010 and it releases an update every three year. The current 2022 edition of the index is the result of a close cooperation between the Joint Research Centre and DG Regional and Urban Policy.
The index is based on 68 indicators, to capture the underlying factors that support a region’s long-term economic development. Short-term biases, as for example the anomalous drop in the number of flights due to COVID-19, have been avoided by feeding the indicator with data from 2019 instead of 2020 and 2021.
The Regional Competitiveness index is a powerful tool to provide policymakers and citizens with information to make evidence-based decisions. Monitoring frameworks, such as this index, are essential for assessing progress and thereby informing policy priorities, anticipating challenges and devising strategies.
Details
- Publication date
- 27 March 2023
- Author
- Joint Research Centre
- JRC portfolios