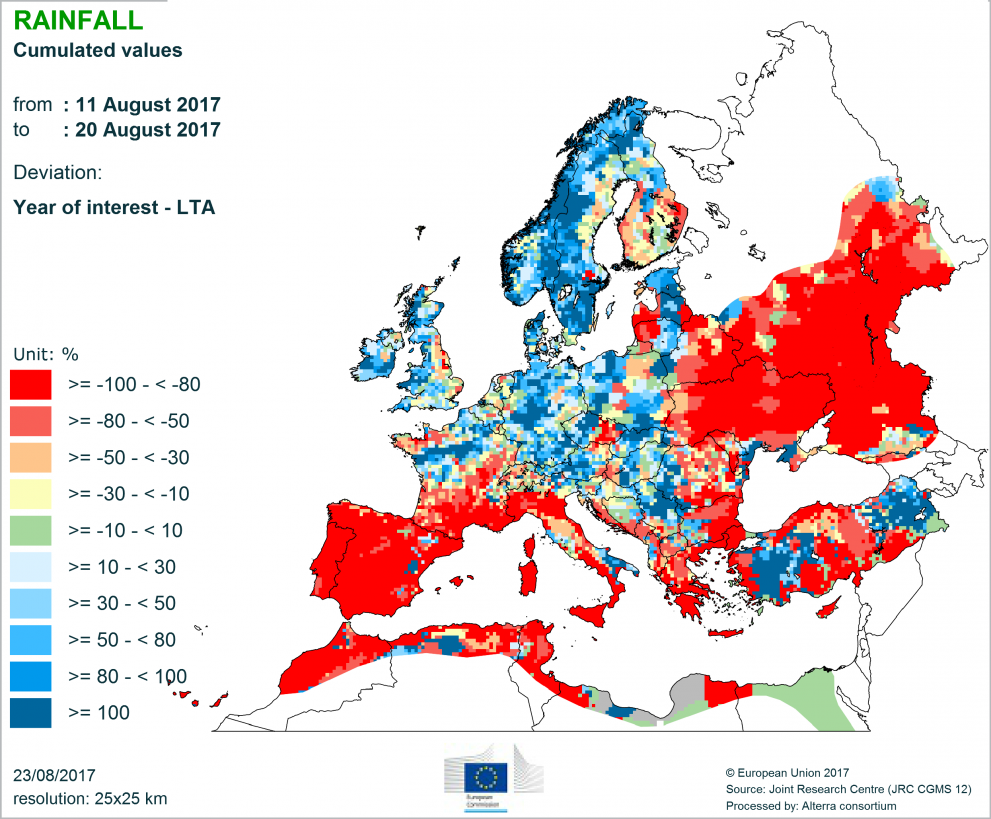
Web users worldwide can now view weather and crop conditions in near real-time across the whole of the EU, thanks to the JRC MARS Explorer, a pioneering new e-service from the European Commission’s Joint Research Centre (JRC).
Thousands of individuals and organisations from various levels of government, industry, media, and research and development already benefit from information provided by the MARS crop monitoring Bulletin, which celebrates its 25th anniversary this year.
The Bulletin provides monthly updates on weather conditions, crop monitoring and crop yield forecasts for EU member states and neighbouring countries.
The JRC MARS Explorer gives existing and new users access to a much larger set of data and at a significantly higher frequency.
How does it work?
The JRC MARS Explorer provides quick access to high-resolution maps and graphs that are updated three times per month.
These pre-prepared images display both crop and weather information, and can be downloaded and reused by users in their own reports. Weather information is based on observations from several thousand meteorological stations across Europe, while simulations using a computer model provide information on crops.

Weather indicators that can be displayed include: average, minimum and maximum temperature; climatic water balance; number of cold days (with a minimum temperature of less than 0 oC) and number of hot days (with a maximum temperature of more than 30 oC); number of days with significant rainfall; levels of rainfall and the sum of active temperatures over a given period.
When applicable, indicators are put in context by being displayed both as absolute values and in comparison to the long-term average (LTA).
The enhanced frequency of updates will allow users to verify if certain trends that are flagged by the MARS Bulletin continue throughout the month.

Users can also follow the progress of a wide range of crops across the EU, including: winter wheat, spring barley, grain maize, sunflowers, potatoes, rye, sugar beet and oilseed rape.
A number of indicators (such as crop development stage, soil moisture, rainfall around flowering, harvesting and sowing) are displayed.
Further improvements to the MARS Explorer are in the pipeline, with the inclusion of indicators based on remote sensing as the next step.
Background
The Joint Research Centre's crop forecasting activities support the EU Common Agricultural Policy by providing scientifically relevant, independent and timely crop yield forecast products and data.
The data displayed by the MARS Explorer are based on meteorological station data and crop simulations, originating from the MARS Crop Yield Forecasting System. Maps and graphs are updated three times per month.
The MARS crop monitoring Bulletins have provided regular weather and crop monitoring updates since 1992. The 25th anniversary will be formally celebrated with a dedicated conference in Brussels on 18 October.
Related Content
MARS crop monitoring Bulletins
Conference: Contributing to market transparency - 25th anniversary of the MARS Bulletins
Details
- Publication date
- 4 September 2017
